The Self-Terminating Alarm: When Per-Host Scale-In Kills Every Scale-Out
ClickHouse on AWS: Self-Managed from First Principles · Part 26
The writers fleet had a strange property: it could scale out but it could not stay scaled out. Load would rise, the CPU alarm would fire, a second writer would launch — and roughly six minutes later, a different alarm would quietly terminate it. Scale up, get killed, scale up, get killed. The fleet sat pinned at its minimum for hours while alarms on both ends insisted they were doing their jobs.
Nothing was misconfigured in the way you’d expect. Both alarms had sensible thresholds. Both scaling policies worked in isolation. The bug was in an interaction nobody designs for: the scale-in alarm was keyed to a single host, and its own action destroyed its metric source.
This post is the anatomy of that wedge — how a per-host alarm terminates itself, why the alarm never clears, and the two-line redesign (an aggregate alarm on the ASG dimension) that makes scale-in safe.
The setup that wedged
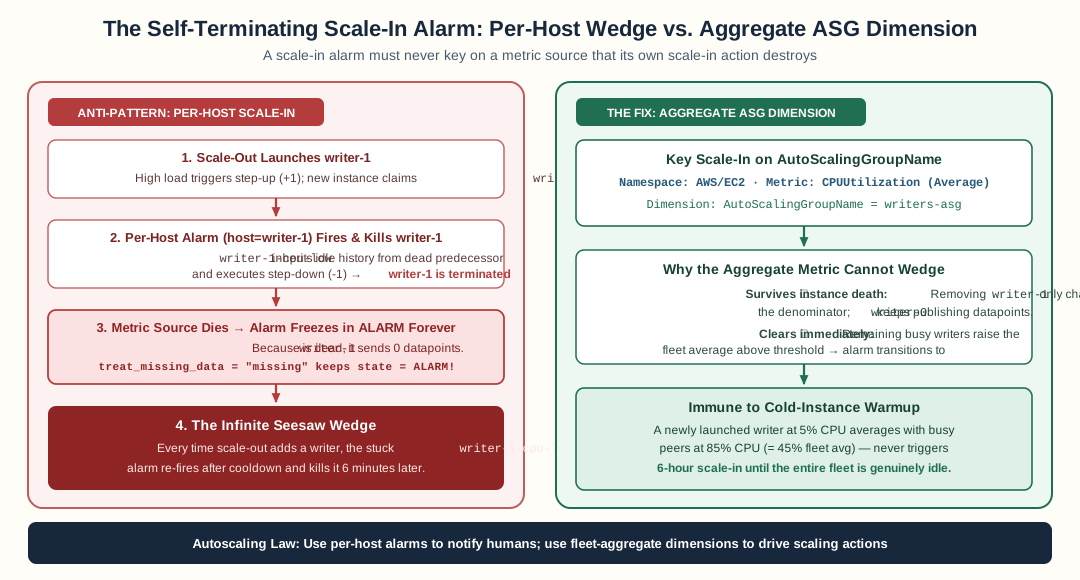
A per-host scale-in alarm kills its own metric source and freezes in ALARM forever under treat_missing_data = "missing"; keying scale-in on the aggregate AutoScalingGroupName dimension survives instance termination and clears as soon as remaining writers carry load.
The writers ASG scaled on two CloudWatch alarms, both reading node-level CPU:
- Scale-up:
writer-N-cpu-high— the agent’scpu_usage_idlemetric for a specific writer hostname, breaching when the host is too busy. Wired to a step-up policy (+1instance). - Scale-down:
writer-N-cpu-low— the same metric for a specific writer hostname, breaching when the host has been too idle for six hours (72 evaluation periods at 5 minutes). Wired to a step-down policy (-1instance), the fleet’s cost-recovery path.
Per-host alarms feel natural when you come to autoscaling from node monitoring: you already have per-host CPU dashboards, so you wire the alarm to the same dimension. The readers fleet scaled on a target-tracking policy keyed to the ASG itself, which is why it never had this problem — but that’s getting ahead of the story.
The wedge, step by step
Here’s the sequence that repeated for hours, reconstructed from the ASG’s scaling-activity history:
- Minute zero — Ingest load rises.
writer-0-cpu-highbreaches; the step-up policy adds a writer. The ASG launches a second instance, which claims thewriter-1ordinal lease and comes up as writer-1. - Six minutes later — the low-CPU alarm for the writer-1 name fires. Six minutes earlier this alarm had started watching the new writer-1, a fresh instance whose CPU is naturally idle while it warms up joins, fetches its replica queue, and waits for load to balance across the fleet. A fresh writer is a low-CPU writer. The alarm’s threshold — idle for 6 hours — was satisfied by datapoints inherited from the dead predecessor of the same name (more on that in a moment), or in the faster variants, by the alarm simply still being in ALARM from its previous evaluation.
- The step-down policy terminates writer-1 — the instance the scale-up just paid for.
- Cooldown ends — the
writer-1-cpu-lowalarm is still in ALARM. Its host is terminated; its metric has no source. CloudWatch’streat_missing_data = "missing"preserves the alarm’s last state, and the alarm re-fires the step-down policy at the next evaluation. The next victim is whichever instance the ASG picks — sometimes the original writer-0, sometimes a newly-scaled-out node. - Go to step 1.
Two properties of CloudWatch alarms make this loop unbreakable from the inside:
A dead host’s alarm never clears. With treat_missing_data = "missing", an alarm whose metric vanishes stays in its last state — ALARM — indefinitely. It doesn’t go to OK (that would stop the scale-ins). It doesn’t go to INSUFFICIENT_DATA (that wouldn’t fire the policy, but it also wouldn’t tell anyone). It just sits there, armed, re-firing the step-down policy after every cooldown, forever.
The alarm’s dimension is a name, and names get recycled. The fleet’s identity layer gives the ordinal writer-1 to whichever instance holds the lease. When the first writer-1 was terminated and a replacement claimed the same name, the per-host alarm started watching the new instance — but its 72-period evaluation window was already full of the old instance’s idle datapoints. The fresh writer inherited a six-hour idle verdict on its first minute of life.
Why this is an autoscaling anti-pattern, not a bug
The deep problem: a scale-in alarm must not have a metric source that its own action destroys. The whole point of scale-in is to remove an instance. If the alarm that triggers removal is keyed to that instance, every removal orphans the alarm in its triggered state, and a triggered scale-in policy on cooldown is a standing order to remove the next instance.
Per-host alarms are fine for notifying — “writer-1 has been idle for six hours” is a useful Slack message. They are categorically wrong for acting. The action belongs to a metric that describes the fleet, because the fleet is what the ASG scales.
The same logic applies to any per-entity alarm wired to an action that changes the entity population: per-pod alarms driving pod deletion, per-node alarms driving node drains, per-shard alarms driving shard rebalancing. The moment the action can remove the metric’s subject, the alarm needs an aggregate dimension instead.
The fix: one aggregate alarm, keyed to the ASG
AWS publishes AWS/EC2 CPUUtilization with a built-in AutoScalingGroupName dimension — the fleet-average CPU, maintained by the service itself, computed over whichever instances exist right now. It has exactly the properties a scale-in alarm needs:
- It survives instance termination — the average is over the ASG, so removing one member just changes the denominator.
- It clears when the remaining fleet is genuinely busy — after scale-in, if the survivors are at 80% CPU, the average says so and the alarm goes to OK.
- It cannot be satisfied by a new instance’s warmup — the average includes every in-service instance, and one cold instance cannot drag a fleet average below a six-hour idle threshold.
resource "aws_cloudwatch_metric_alarm" "writers_asg_idle" {
  count = var.enabled && var.writers_step_down_policy_arn != null ? 1 : 0

  alarm_name          = "${local.alarm_prefix}-writers-asg-idle"
  namespace           = "AWS/EC2"
  metric_name         = "CPUUtilization"
  statistic           = "Average"
  period              = 300
  evaluation_periods  = 72          # 6 hours of sustained idleness
  threshold           = var.scale_down_cpu_threshold
  comparison_operator = "LessThanThreshold"

  dimensions = {
    AutoScalingGroupName = var.writers_asg_name
  }

  # Scale-IN policies fire on the ALARM state (AWS semantics: ok_actions
  # never invoke scaling). The step-down policy goes here, next to SNS.
  alarm_actions = compact(concat(
    local.alert_topic_arns,
    [var.writers_step_down_policy_arn],
  ))
  ok_actions = local.alert_topic_arns
}
And the per-host alarms stay — demoted to guidance:
# Per-host low-CPU alarms: GUIDANCE ONLY (SNS, no scaling action).
# The scale-in decision belongs to the aggregate writers-asg-idle
# alarm, which survives host death.
alarm_actions = local.alert_topic_arns
The comment in the code says it best: this alarm’s metric dies with its host; wiring a scaling action to it is the wedge, never a feature.
Detecting the wedge before it costs you hours
Three signatures would have caught this the day it started:
- An alarm in ALARM with no recent datapoints. After its host terminates, the per-host alarm sits in ALARM against a dark series. Any liveness check over your alarm inventory — “list alarms in ALARM whose metric has no data in the last N periods” — flags it immediately. (This is the same gray-state discipline from the keeper monitoring post; the states differ but the smell is identical.)
- Scale-out and scale-in inside one cooldown window. The activity history showed
+1followed by-1six minutes later. A healthy fleet under steady load sees scale events minutes-to-hours apart, not seesawing inside a single cooldown. A tiny query overDescribeScalingActivities(or a metric-filter on your activity stream) makes seesaws visible. - The fleet pinned at min while a scale-up alarm is also firing. If scale-up keeps succeeding and capacity keeps ending up at min anyway, something is undoing the scale-ups. The two alarms firing at the same time — one saying busy, one saying idle — is itself the tell: they cannot both be describing the same fleet.
The general lessons
- Scale-in alarms key on the fleet dimension, never the instance.
AutoScalingGroupNameexists precisely so your scaling decisions can observe the thing being scaled. Use it for any alarm with a scaling action. - An alarm wired to an action must survive the action’s side effects. Ask of every action-alarm pair: “does the action change the population this metric measures?” If yes, aggregate the metric or reconsider the trigger.
treat_missing_datais a design decision, not a default. For a per-host alarm that survives termination,missingturns a dead series into a permanently armed trigger. Decide explicitly what each alarm’s gray state means.- Recycled identity + long evaluation windows = inherited verdicts. If your fleet gives recycled names to replacements (lease ordinals, stateful-set ordinals), a per-name alarm’s window mixes datapoints from different physical instances. Another reason the action-grade metric must be aggregate.
The fleet now scales out under load, holds, and scales back in when the aggregate average says the capacity is genuinely surplus. The per-host alarms still page — as guidance, they’re useful — but the terminations belong to a metric that can’t be killed by its own decision.
FAQ
Why does a per-host CPU alarm break ASG scale-in?
The alarm is keyed to one instance's hostname dimension. When its scale-in action terminates that instance, the metric source dies — CloudWatch keeps the alarm in its last state (ALARM) because treat_missing_data=missing preserves it. After every cooldown the alarm re-fires the step-down policy, terminating whichever instance is now lowest-priority, including instances a scale-up just added.
How do you scale in an ASG on CloudWatch alarms safely?
Key the alarm on the AutoScalingGroupName dimension — the AWS/EC2 CPUUtilization metric averaged over the ASG. The metric survives any individual instance's death because it is fleet-wide, so the alarm clears when the remaining fleet genuinely has capacity, and one alarm drives the whole scale-in decision.
Can you detect this wedge before it bites?
Watch for an alarm that stays in ALARM with no datapoints for longer than its evaluation window, and for scale-out/scale-in seesaws inside a single cooldown. Both signatures appeared in the scaling-activity history: a scale-up and a scale-down six minutes apart, repeating for hours while the fleet sat pinned at minimum.
Stay in the loop — production notes on AI agents, workflows, and SRE.
Low volume — new posts and curated reading lists. Unsubscribe anytime.