You Can't Debug What You Can't See — Observability for AI Agents
Featured by CNCF. An edited version of this article was published on the Cloud Native Computing Foundation blog.
A service can return a successful response even when an agent has asked the same question repeatedly, spent far more than expected, or reported a result that its tools do not support. Standard application performance monitoring (APM) tells you whether requests were fast and error-free; it does not explain the sequence of decisions inside an agent session.
We have run AI agents for site reliability engineering (SRE) teams in production for months. The following signals helped us investigate their failures. They add to ordinary service monitoring rather than replacing it.
What We Need to Answer
For an agent session—a task from start to finish—we want to know why its cost rose, whether tools repeated without progress, what evidence supports its final answer, and which dependency or model caused an error. Counters for HTTP latency and error rates cannot answer those questions alone. Prometheus metrics and Grafana dashboards still help with alerting and service health; detailed session timelines supply the missing context.
1. Traces Show the Sequence
A trace records the session’s model calls, tool executions, and delegated sub-agent work, including their timing and costs. We send traces to Langfuse. Each operation is a span (one timed unit of work); child spans under a delegation make it possible to follow a sub-agent without losing the parent task.
We batch and export spans without making a tool call wait for the trace service’s HTTP response. On shutdown the exporter attempts to flush pending data. If the backend is unavailable, this design favors agent availability over complete telemetry. That tradeoff should be explicit: buffered spans can be lost on a crash, and an outage of the tracing service will leave gaps.
2. Cost and Budgets Catch Runaway Work
A token is a unit of model input or output that providers use for usage and billing. We track usage and estimated cost per session, including which model handled each call, and per agent over time, including session counts and daily trends. This lets us distinguish one expensive investigation from a sustained increase.
Repeated tool calls and growing context can increase cost quickly, especially when several agents work at once. We use hard iteration caps, per-tool call budgets, and detection of identical consecutive calls to stop some loops before an alert arrives. A cost alert for a session above a multiple of that agent’s rolling average catches slower anomalies that those limits may miss. Cost spikes warrant investigation; they are not proof of a bug, since some incidents genuinely require more work.
3. Audit Records Support Reconstruction
Tool calls, governance decisions, and memory operations are written to a structured, timestamped, append-only audit record. We sanitize sensitive tool output before logging it. Audit is for review after the fact; it cannot block an unsafe call and redaction can both miss sensitive material and obscure details an investigator needs.
A Quick Dependency Check
Our doctor command, named after utilities such as brew doctor, checks model connectivity, vector-store reachability, pending approvals, memory counts, trace-backend status, and integration health. It points an operator toward an unhealthy dependency without requiring an initial search across several dashboards. A passing check only reflects what was tested at that moment.
Review Sessions Without Reading Every Trace
We run automated reviews of completed traces for duration, cost, tool count, repeated calls, and token-efficiency flags. Sessions with anomalies such as loops, errors, or unusually high cost go to human review. This reduces manual triage volume, but threshold-based review can miss subtle wrong answers with normal-looking costs.
Metrics and Traces Have Different Jobs
For real-time dashboards, we export bounded metrics such as success and failure rates by tool, agent-level cost, approval latency histograms, and classification counts. Traces and structured logs retain per-session detail.
Avoid unique session IDs as Prometheus labels: each new value creates another time series. Tool and agent names can be bounded labels if your deployment controls their number; even those labels need scrutiny when users can create arbitrary names. Thousands of unique session labels can overwhelm metric storage. Put the session ID in a trace instead.
| Signal | Question it helps answer |
|---|---|
| Session cost against a rolling average | Is this task using unexpectedly many model calls or tokens? |
| Repeated identical tool calls | Is it stuck on an action? |
| Approval latency | Is human review delaying the task? |
| Model error rate | Is a provider failing? |
| Vector store and integration health | Is a dependency silently unavailable? |
| Daily token use against budget | Is spending approaching a limit? |
| Audit log growth | Is execution unusually frequent? |
For our platform, traces are the starting point for debugging individual tasks, metrics are useful for alerting, and audit records explain what was allowed and executed. None alone tells us whether an answer was useful to an on-call engineer.
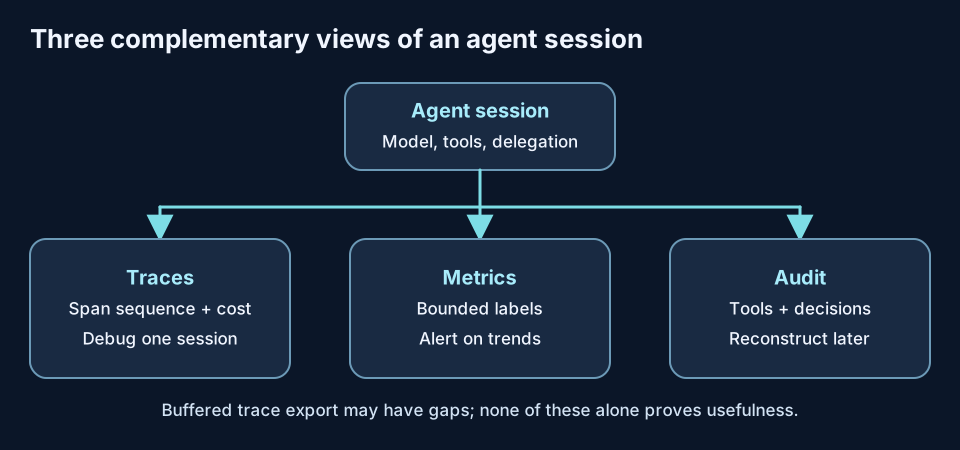
These are complementary views of one session: a metric alerts, a trace explains a sequence, and an audit record helps reconstruct decisions.
Related reading
- LLM Tokenomics for Production Agents — context budgets and cost attribution
- AI Incident Triage for SREs — what to gather once sessions are visible
- More on AI agents for SRE · full series
What signals help you investigate agent failures? Find me on GitHub or LinkedIn.
StackGen builds AI-assisted SRE tools. Our offering at ai.stackgen.com supports incident triage, diagnostics, and draft root-cause analyses.
FAQ
Why does traditional APM miss AI agent failures?
Request latency and error rate do not explain why an agent asked the same question three times or burned a token budget looping on tools.
What signals do you need for agent observability?
Session-level traces, tool-call attribution, token budgets, and audit trails — not just HTTP metrics.
Was this observability post published elsewhere?
Yes. An edited version was featured on the CNCF blog covering observability for AI agents.
Stay in the loop — production notes on AI agents, workflows, and SRE.
Low volume — new posts and curated reading lists. Unsubscribe anytime.