Your RCA Agent Doesn't Need Another Runbook — It Needs a Map
A runbook can tell an incident agent which queries to try, but it cannot describe every dependency or data gap in a changing environment. We found that the agent also needed a map of the services and evidence it could check.
Our site reliability engineering (SRE) copilot investigated incidents across several data sources. The work spanned multiple observability planes (metrics, logs, traces, and an analytics warehouse), fixed-stage pipelines (a directed graph of plan → gather → present — not a free-form chat loop), and two intake shapes: firing alerts and human symptom tickets.
Both intake paths exposed a similar limit:
If an agent needs a new, long runbook for every estate, it may lack reusable service topology, evidence checks, and a way to learn from corrected investigations.
By “map” I mean those reusable inputs and checks, not a replacement for human procedures. This post describes where scripted steps helped, where they failed in our examples, and what still needs implementation.
What the map is
A map is not another markdown standard operating procedure (SOP). In our design it has four parts. Some are proposed or incomplete, as the open issues below make clear:
1. Topology at launch
Discovery already knows which integrations exist (metrics, logs, warehouse, Git), which services and env tags appear in your estate, and which repos deploy to which workloads. Inject the available graph at investigation launch so the agent starts with known connections rather than assuming dependencies. Discovery can be incomplete or stale, so the graph remains a starting hypothesis.
Without it, every incident is a blind crawl. With it, “check deploy correlation” is a first-class probe, not folklore buried in a static PDF.
2. Verify-first probes
Each investigation branch must write structured evidence — machine-checkable keys like queue_depth_spike=true, readiness_pct=96.6, or warehouse_crosscheck=mismatch. Root-cause analysis (RCA) prose comes after those fields exist.
A proposed hypothesis verifier would map those keys to a root-cause class using deterministic code rather than a second model. Structured fields support checking but do not themselves establish causality; an operator must be able to challenge the class.
3. Cross-plane reconciliation
Real incidents rarely live in one datastore. The map requires each plane to get a turn, then a mandatory crosscheck field that resolves to match, mismatch, or single_plane — not pending when gather declares complete.
When metrics say “0.007% errors, issue inactive” but pods restarted once, the headline for that scoped path is no active incident, while the restart remains a fact to investigate if relevant. Reconciliation is a presentation contract, not prompt flair.
4. Verify-learn memory
When an operator confirms or corrects a verdict, store the class, service fingerprint, and what was ruled out. On the next similar alert, surface that memory so the agent does not reopen solved dead ends.
Confirmed and corrected verdicts could make later searches more focused, provided the stored fingerprints and decisions are reviewable. This is a design direction, not evidence that memory already prevents repeat mistakes.
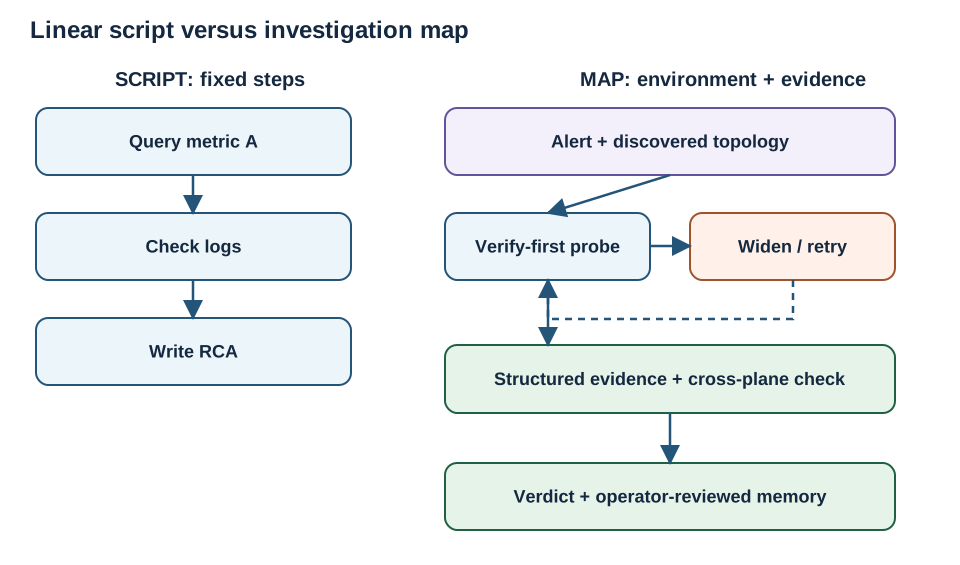
The map is a proposed navigation layer; stable runbook recipes remain useful overlays.
RUNBOOK (script)                 MAP (environment)
─────────────────                ───────────────────
Step 1: query metric A           Alert + topology (injected)
        │                                │
        ▼                                ▼
Step 2: check logs               Verify probe ──(dead end?)──► widen / retry ──┐
        │                                │ (confirmed)                        │
        ▼                                ▼                                    │
Step 3: write RCA                Rank hypothesis ◄────────────────────────────┘
        │                                │
        ▼                                ▼
(linear — fixed steps)           Verdict + memory (stored for recall)
                                 (branching — retries on failure)
| Script model | Map model |
|---|---|
| Ship another notebook per failure mode | Agent knows probe → discover → requery |
| New gate regex per tenant phrasing | Verifier reads structured evidence keys |
| Dependency map checkbox in gather | Topology injected at launch |
| Operator corrects RCA in Slack | Verdict → memory → next run recalls prior |
| Score workflow note tokens | Score expected vs detected root-cause class |
Bespoke investigation stacks — per-tenant notebooks, stage-gate regex, spawn allowlists — are symptoms of a copilot that did not yet have the four layers above. If these layers prove useful, some tenant-specific notebooks and gates may shrink. Local procedures and exceptions will still remain.
When runbooks still earn their keep
The map does not make runbooks obsolete. A known, stable incident class still benefits from a documented sequence, and humans need procedures for escalation and remediation.
Runbooks stay valid when:
| Role | Why it works |
|---|---|
| Human SOP | On-call engineers, auditors, and new hires need a readable ladder for rare events. The PDF is for people, not a substitute for injected topology. |
| Stable, bounded archetypes | You’ve closed the same alert class fifty times; the probe sequence is known (queue depth → consumer tag → rebalance). Encode that as recipes on the map, not rediscovery every run. |
| Reference demo | Greenfield estates need a worked example before discovery is rich. A reference notebook as an optional demo while the platform map matures is fine. |
| Human-in-the-loop (HITL) remediation | The map ends at evidence and class. The runbook documents who approves scale-down, which job to run, what lands in the ticket. Investigation vs blast-radius governance are different artifacts. |
| Local overlay | Env-specific dashboard IDs, tag quirks, “always widen to 7d on this monitor.” Templates on top of topology + verifier — not the entire navigation layer. |
The failure mode was runbook as sole navigation: many estate-specific pages compensated for missing discovery and verification. Topology, gates, and memory are intended to supplement those pages; their effectiveness still has to be tested against live investigations.
When the map is missing: production failure modes
In the happy path, metrics confirm the window, logs corroborate, and the final paragraph names a mechanism an on-call engineer would act on. Without the map, the same model ships gorgeous closing prose on top of a hollow middle stage.
Common patterns:
- Wrong time window — stop at 30 minutes when the signal only appears at 7-day cadence; declare victory in the wrong clock.
- Loudest spike wins — rank correlation over causation.
- Hollow gather — fluent narrative while a middle stage never committed tool receipts.
- Premature “observability gap” — give up before widening the window, fixing env tags, or running tag discovery.
- Sub-agent loops — spawn helpers until a spawn budget (max LLM turns per worker) exhausts, leaving
pending_from_*stubs the gate accepts anyway.
Operators need receipts: concrete IDs, numeric KPIs, ruled-out branches, and next probes that survive a deterministic check.
Prior posts in this series drill into specific antidotes: evidence-gated RCA, bring-up like hardware, evidence-based verification. This one is the product frame they fit inside.
Two venues where scripts broke
I’ll describe incidents in parallel universes — no real org or env names.
Metric-backed alerts (two archetypes)
Shape A: depth on one queue in a message broker — cluster-wide totals look fine; the spike hides behind a single routing key you still have to find.
Shape B: saturation on one link in a dependency chain — the alert names this hop; a second observability plane says the bottleneck slid downstream.
Different alerts, same script failures — two parallel use cases, one failure table:
| What a good run proves | What the script did instead |
|---|---|
| Primary signal with numbers, not “elevated” | Stopped at a window too narrow for sparse metrics |
| Primary scope key identified with evidence | Pasted redacted placeholder tokens into SQL → syntax errors → retry loop |
| Cross-plane crosscheck resolved | Left pending forever while gather declared complete |
| Queue consumer or pod health with concrete fields | Wrote blocked: no data or pending_from_* while gate cheered on non-empty text |
| Presentation uses gather transcript | Read only navigation JSON (“FINISH, iter=1”) and ignored evidence |
Fixes were rarely “more poetry in the runbook.” They were topology + verifier + gates: UUID-aware regex, forbidden hollow stubs (branch dispatched… is not evidence), spawn contracts that allow tag-discovery tools, and headlines that say no active incident on scoped path when the signal is inactive. The runbook’s probe ideas were often right; the platform had not encoded them as structured evidence and gates.
Symptom tickets (human words, messy scope)
Intake: “Payments module stuck after deploy in production since Tuesday.”
No metric attached — so structure first: parse Environment / Module / Symptom / Time, ladder env tags (non-prod before prod), check the obvious deployment and adjacent services (edge tier, worker, admin — not only the name in the ticket), query log monitors with log search rather than metric queries on log-based alerts.
What went wrong: keyword routing (the module name in the ticket matched an unrelated queue-depth workflow), clarifying-question loops while the user said “just investigate,” and monitors attached because a title contained a keyword. Wrong genre, wrong hall.
Trap: treat human intake like a firing metric alert. The map starts with scope parsing, not tool roulette.
Golden gates (and a testing failure we owned)
Even with a map, you need to prove each pipeline stage before you trust the whole run.
Bring-up works like hardware bring-up: imagine a fixed pipeline — plan scope → gather evidence → present RCA. Deploy only stages 1 through N, run one canary investigation, and pass an automated gate (a function over tool outputs, not LLM adjectives) before you wire up stage N+1. Green one stage until it is boring; then add the next. A failed stage-2 check narrows the search to stage 2 and its inherited inputs; it does not prove earlier stages were flawless. (Full hardware analogy here.)
Gates are only as honest as their tests. We learned that the hard way:
- The expectation: Gate regex demanded the literal English phrase
tenant GUID. - The reality: The agent correctly emitted a raw
UUID. - The result: False failure — and shape-only gates that accepted empty shells while rejecting valid data.
We also shipped a gate regular expression with negative lookahead. Go’s RE2 regular-expression engine does not support that syntax, so the gate crashed after gather had produced evidence. Both passing and failing fixtures, plus compilation of gate expressions in continuous integration (CI), would have caught this before a run.
Lesson: treat gates like unit tests — pass and fail fixtures, run in CI, score tool effects not mood words.
Shipping the map in slices
The map only ships if the platform codebase practices what the agent preaches: modular stages, verifiable contracts, strictly typed evidence — not one monolithic branch nobody can review.
We split the work:
- Manifest DNA — skills, agents, workflows (what the investigator is allowed to believe).
- Hedge gate — reject soft “likely broader instability” RCA unless dig-ladder exhaustion is documented.
- Change plane — discovery-derived deploy candidates at launch when Git is connected.
- Eval harness — shipped separately from the production investigator.
Incremental rehearsal, not a double soundtrack.
What still goes wrong
No hero narrative. Current board:
- Inactive incidents scored as
undetermined— presentation lacks an “issue not active” mode. - Path anchoring — alert path vs warehouse-dominant path confuses headlines.
- Spawn budgets — workers hit max LLM calls; gates still accept
pending_from_*. - Chat path loads orchestration skills but never runs tools — routing is not investigating.
- Mitigation homework — “confirm latency in dashboard” instead of running the verification query.
These open issues include gate, routing, and workflow-contract failures. Some may be fixable without changing models, but each fix needs to be checked against actual run behavior.
Practical checks to try
If you are building agentic RCA (or any multi-stage compound system):
- Inject topology at launch — do not make the model draw the map mid-run.
- Structured evidence → verifier → class — LLM drafts; code locks.
- Cross-plane crosscheck — mandatory resolution before present-RCA.
- Verify-learn memory — store verdicts; recall on similar fingerprints.
- Bring-up rails — green one stage at a time; gates on tool effects.
- Golden pass and fail fixtures — including regex and gate-engine compatibility.
- Runbooks as overlay, not foundation — keep human SOPs and stable probe recipes; do not make the agent depend on a fresh notebook per estate.
The goal is not an agent that recites your runbook line by line. It is an agent that walks in with a map — optionally guided by runbook recipes you have already proven — and enough humility to run the boring ladders before calling the incident closed.
Possible next experiments include hypothesize-then-verify, causal graphs pruned per alert, and process-focused evaluations that check actions and evidence rather than the closing paragraph.
Further reading (same series):
- Evidence-Gated RCA — Prove, Then Narrate
- How We Debug Multi-Stage AI Agent Workflows
- Evidence-Based Verification
- AI-Augmented Incident Triage
We build incident-triage agents at StackGen; the SRE offering is at ai.stackgen.com.
FAQ
Why aren't runbooks enough for an RCA agent?
Runbooks help humans on stable ladders. As the agent's only navigation they become brittle scripts. Topology, gates, and verify-first beat another long notebook.
What should replace a script-shaped runbook for agents?
A map: service topology, evidence gates, and verify-first checks across observability planes — not a single forty-page procedure the model must recite.
What intake shapes did the multi-plane RCA work cover?
Firing alerts and human symptom tickets across metrics, logs, traces, and analytics — inside fixed-stage pipelines rather than free-form chat.
Stay in the loop — production notes on AI agents, workflows, and SRE.
Low volume — new posts and curated reading lists. Unsubscribe anytime.