Why AI SRE Feels Stuck Before the First Tool Call
An alert fires. Chat says “investigating,” but no diagnostic query appears yet. In these incident patterns, some of that wait came before the model could use a tool: the worker rechecked its secrets vault and rebuilt an unchanged catalog of available actions. Measure that wait separately from the model’s response time.
The incident patterns below are composite and anonymized. Counts are rounded. Names, IDs, and infrastructure details are fictionalized to protect customer confidentiality.
What to measure first
For an alert that needs a Grafana metric query, record the time from the operator’s request to the first useful query, not just the time until the chat says “investigating.” A repeat vault check (confirming access to secrets) or an unchanged MCP tool catalog (the list of actions available through Model Context Protocol) can consume that interval without advancing the investigation. Share readiness per worker and skip index writes when the catalog hash has not changed. These changes reduce setup work; they do not make a slow diagnostic query fast.
Two efficient fixes
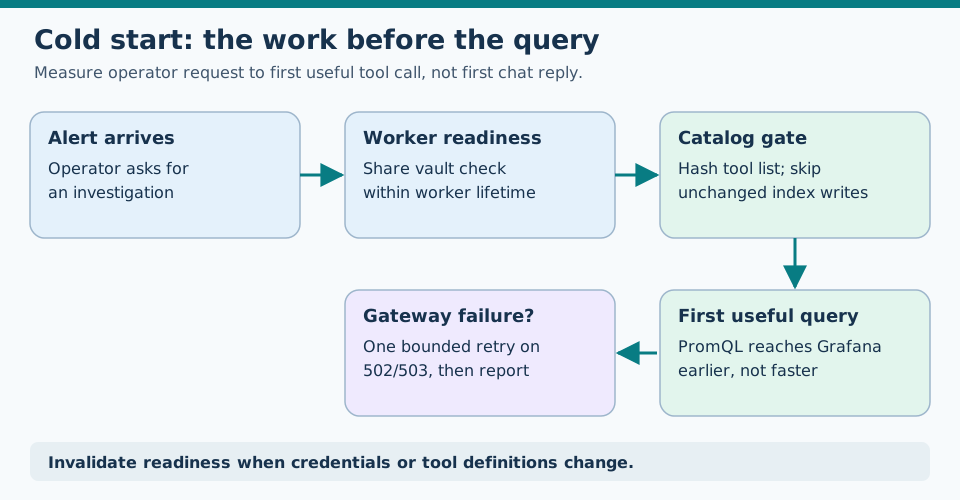
Caption: Shared readiness and skipped no-op catalog writes shorten setup before the first useful query; a 502/503 gets one bounded retry.
1. Catalog and secrets tax. Re-checking vault and re-upserting an unchanged tool index delays first PromQL, Grafana’s query language for metrics. Cache readiness for the worker’s lifetime; hash the catalog and skip no-op writes. Invalidate the cache when credentials or tool definitions change, or stale access can become a security and correctness problem.
2. Gateway blip ≠ circuit open. A 502 or 503 is a gateway/server error, not proof that the Grafana data source will stay unavailable. One such response used to mark it dead for the rest of the run. Retry once with a short bound, then surface the failure; unlimited retries would hide a real outage and delay the operator.
Long investigations also need a loop detector (a guard against repeating the same action) whose window accounts for legitimate tool calls that take minutes; a 30-second timeout can mistake waiting for a result for a stuck retry. That is another efficiency story: stop the true stuck retry without false-positive blocks.
Tokenomics context: maintaining tokenomics.
If you lead an SRE team
- Measure time-to-first-useful-tool-call on investigate
- Page on sustained cold-start regressions the way you page on API latency
- Do not accept “the model is thinking” as the explanation for repeated vault readiness checks
If you ship the agent platform
- Fail closed on empty vault secrets when advertising tools — but do not re-pay the check every message
- Retry once on known gateway classes; then surface honest failure
- Align workflow loop-detection TTL with real investigate durations
Related
- Previous: Measure the Firing Expression First
- Next: One Zip, One Conversation
- Series: Service Rendered Efficiently
Acknowledgments. Cold-start and Grafana retry lessons from Aiden integration work. Patterns composite.
Building AI for incident triage without the demo theater? Find me on GitHub or LinkedIn.
FAQ
What slows AI SRE investigation cold start?
Often vault readiness checks and re-indexing unchanged MCP tool catalogs — not the LLM. Shared readiness and skipping unchanged upserts move first useful tool calls earlier.
Should one Grafana 502 abort the whole triage run?
No. A single automatic retry on proxy gateway failures avoids opening the circuit for the rest of the investigation on a transient blip.
Why is cold-start latency an on-call SLA?
Operators experience dead air as 'the bot is stuck.' Cutting vault and index tax moves the first useful PromQL earlier — not infra trivia.
Stay in the loop — production notes on AI agents, workflows, and SRE.
Low volume — new posts and curated reading lists. Unsubscribe anytime.