LLM Performance Metrics — From Lighthouse to the Token Era
Web performance work asks when a page becomes useful, how long the main content takes, and whether the interface stays stable. Those questions still help when the feature calls a large language model (LLM), but the measurements change. An LLM generates output a piece at a time; a page usually renders bytes already sent to the browser.
This is a comparison for debugging, not a claim that Google’s Lighthouse scores can be applied to model responses. In particular, broken JSON is not literally a layout shift, and prompt processing is not browser main-thread blocking.
| Web concern | Related LLM concern | Important difference |
|---|---|---|
| First Contentful Paint (FCP): first rendered content | Time to first token (TTFT) | A token can be an invisible or unusable fragment, not useful feedback |
| Largest Contentful Paint (LCP): main visible content | End-to-end completion time | An agent may run several model calls and tools before it finishes |
| Total Blocking Time (TBT): main-thread tasks over 50 ms | Queue and prompt processing time | The browser may remain interactive while the server works |
| Cumulative Layout Shift (CLS): unexpected movement | Output validity and structural consistency | This is a parser/workflow failure, not a visual metric |
First response: TTFT
Time to first token (TTFT) is the elapsed time from sending a request until receiving the first generated output token. A token is a small unit of text the model produces; it might be part of a word or the opening { of a JSON object. For a streaming API, mark the request send time and the first actual content chunk received over server-sent events (SSE) or a WebSocket:
user_submitted_at → first_token_received_at = TTFT
Decide whether your clock starts at the user click or at the model API call. The former includes application routing and retrieval; the latter doesn’t. Log the choice. Segment by model, region, and prompt-size bucket.
A long TTFT can come from connection setup, provider queueing, cold inference capacity, safety or routing checks, or processing a large input prompt. A streaming response can give earlier feedback than a fully buffered one, but turning on streaming does not shorten the model’s computation. For example, a 30-second response with a first token at 400 ms presents a different wait from an 8-second silence followed by a buffered answer; the example illustrates perceived feedback, not a measured satisfaction result. Likewise, a “thinking” indicator during retrieval is interface feedback, not a first model token. If retrieval is required to ground the answer, don’t start an ungrounded draft merely to make TTFT look good.
For an agent that calls tools, measure the silence after each tool result as well as the initial wait. The first message may arrive quickly while a tool call is followed by 15 seconds of silence on the next model call. Track each hop as conversation history grows.
Completion time and output rate
Total generation time here means the interval from user submission to the final output token. For an agent, also record the separate task-completion time, including tool work, retries, and any final validation. Those are not interchangeable measurements.
user_submitted_at  →  last_token_received_at  =  Total Generation Time

effective_duration ≈ TTFT + (output_tokens / TPS)
Tokens per second (TPS) is output throughput during generation; time per output token (TPOT) is the related average interval per generated token. Define whether the first token is excluded before comparing TPOT across providers. The approximation leaves out pauses, retries, tools, and any difference between provider and client clocks. At 200 ms TTFT and 80 TPS, 400 output tokens take about 5.2 seconds; at 15 TPS they take about 27 seconds. The same quick start can lead to very different waits. On the web, a fast initial spinner followed by a 12-second hero-image load likewise does not make the main content timely.
Log output-token count and per-step durations. Long outputs, low throughput, sequential tool calls, malformed output requiring a retry, and reasoning tokens (when a provider counts or exposes them) can lengthen a run. Shorter requested answers help only if they still answer the question. Parallelize tool calls only when they do not depend on one another; cache only when reuse will not return stale or user-specific information. Don’t “repair” truncated JSON and assume the missing meaning is known—validate before acting, and retry when the answer cannot safely be recovered.
The wait before generation
The timeline shows why first-token latency includes queueing and prompt processing, while a safely usable result can require validation after the last token.
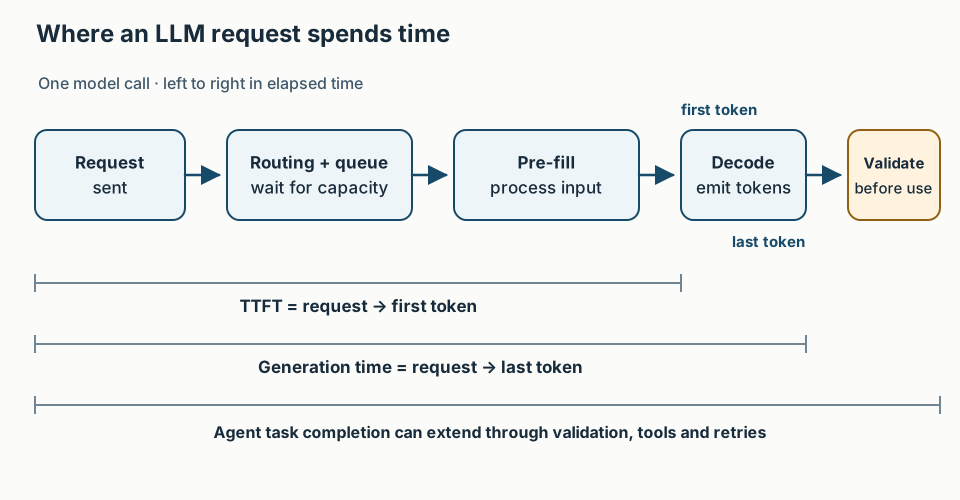
Pre-fill, also called prompt processing, is the inference work on input tokens before the model starts producing output. Queue time is the wait for available inference capacity. Both contribute to TTFT, along with routing and network time; TTFT is not measured after pre-fill.
| Phase | What happens | What to inspect |
|---|---|---|
| Queue | Request waits for compute | Provider queue timing if available |
| Pre-fill | Model processes prompt, history, retrieved material and tool results | Input-token count and provider prompt timing |
| Decode | Model produces output tokens | Output-token count and generation time |
A 10,000-token PDF, 40 retrieved chunks from retrieval-augmented generation (RAG, inserting searched material into the prompt), or a large kubectl describe result increases the input the model must handle. Even 50 loosely selected RAG chunks can leave a model processing irrelevant text. Longer prompts often increase pre-fill time, but the relationship depends on hardware, batching, caching and model architecture; don’t assume a fixed linear slope.
If the provider exposes queue_time_ms, prompt_tokens / prompt_eval_duration, and completion_tokens / eval_duration, record them. Otherwise compare request-to-first-content time with input-token counts across similar requests; that correlation does not isolate pre-fill from queueing. Cap history, select fewer relevant documents, trim tool output, and use provider prompt-prefix caching where supported. Summaries can drop evidence, so keep links or references to the full source when an investigation needs it. In a multi-step agent, chart input tokens by step: in a five-step investigation, each tool result can increase the context processed on the next call.
Validity is not layout stability
Cumulative Layout Shift (CLS) on the web measures unexpected visual movement. For model output, the useful related question is whether a consumer can safely use the completed response. Streaming markdown can leave a code fence open; a JSON object may truncate; a long generation may stop following its requested format by token 800; a tool-call argument may fail type or policy validation. A classification may even change from safe to unsafe as generation completes; do not act on a partial label. These are possible failure examples, not a fixed threshold. Unlike CLS, this is about data and action boundaries, not pixels.
| Failure | What to check |
|---|---|
| Truncated JSON | Did the stream end normally, and does json.Unmarshal or the schema accept it? |
| Fence-wrapped JSON | Does extraction find the intended data without accepting unrelated prose? |
Wrong type, e.g. "count": "five" |
Does validation reject it before use? |
| Extra or renamed tool field | Does the tool schema reject or explicitly allow it? |
| Unoffered tool call | Does the execution layer block it regardless of model output? |
Measure first-pass parse success, repair and retry rates, abnormal stream endings, tool validation failures, and downstream errors. Structured-output modes and constrained decoding help where providers support them, but they don’t prove semantic correctness. Distinguish a syntax repair from a change in meaning, and validate the result. The ordering issue is covered in why one repair pass isn’t enough. Buffer a complete logical unit or use a parser designed for partial input before executing a tool; never run an unfinished call just because its initial tokens looked valid.
A practical starting trace
When someone says a feature feels slow, locate the time: before first content, during streaming, at a tool call, or after the response while the application parses it. Record these fields for each model request:
| Field | Use |
|---|---|
ttft_ms |
Wait until first content |
total_duration_ms |
Model-call duration; state whether it includes post-processing |
input_tokens / output_tokens |
Context growth, output length and cost proxies |
tokens_per_second |
Output throughput |
parse_success (bool) |
First-pass validity |
retry_count |
Hidden extra work |
model / region |
Compare like with like |
For agents, attach each model call and tool execution as a child span of the overall run. The observability model for AI agents adds cost and audit data. These four web analogies can help organize an investigation, but the actionable measurements are the per-call timings, token counts, tool waits and validation results. A fast first token doesn’t compensate for an incomplete task; a valid JSON shape doesn’t guarantee a correct answer. For a one-shot, non-streamed classification, first-token latency may not be useful at all—measure time to a validated decision instead.
If you’ve found another useful way to break down agent latency or output failures, find me on GitHub or LinkedIn. I work on AI-assisted incident investigation at StackGen; project information is at ai.stackgen.com.
Stay in the loop — production notes on AI agents, workflows, and SRE.
Low volume — new posts and curated reading lists. Unsubscribe anytime.