Dead Projections and Useless FINAL: Tuning ClickHouse Tenant Databases by Reading the Source
ClickHouse on AWS: Self-Managed from First Principles · Part 14
Every ClickHouse tuning article you have ever read has a version it was true for and a workload it was measured on. Most of them don’t say which. So when a fresh cluster install gave me a clean slate to fix the schema of a multi-tenant log analytics platform — one ClickHouse database per tenant, on the shared Amazon Elastic Compute Cloud (EC2) cluster this series has been building — I did the pass differently: every candidate optimization had to be verified in the ClickHouse 26.8 source tree before it shipped. Not the docs. The source.
That discipline saved the schema twice — once from folklore being wrong,
and once from me being wrong. This post is the seven findings that
survived the source walk: a projection that doubled a table’s storage
while being structurally unable to serve a single query, a FINAL that
turned facet panels into 20-second merge jobs, the one-line keeper path
detail that decides whether tenant databases can coexist at all, and
four more.
Key takeaways
- A projection the planner can never pick is pure storage tax. Mine stored the two heaviest payload columns a second time for every part — and missed one column the query reads, so it was never selected once.
SUM(count)over SummingMergeTree is exact across unmerged parts.FINALis only for reading non-summed columns of specific rows. My facet queries dropped from 20-30 seconds to sub-second when it went.- The implicit
{database}macro in replicated keeper paths (Macros.cpp) is what makes one data definition language (DDL) file serve N tenant databases. Without it, same-named tables in different databases collide in Keeper. - Bloom indexes on
mapKeys()/mapValues()do accelerateattributes['k'] = vpredicates in 26.8 — the analyzer resolvesarrayElement(map, key)against the index (MergeTreeIndexBloomFilter.cpp). I nearly deleted working indexes on the folklore that they don’t. - System log tables have no default time-to-live (TTL) — the config read for
<log>/ttlfalls back to an empty string (SystemLog.cpp) — and rotated log tables without one are frozen readonly (SystemLog.cpp), so they are never reclaimed. Configurepartition_byandttlfor every log you run. - The read path decides column order: every stats query arrives as
PREWHERE time BETWEEN ..., so the time column leads the sorting key. - Write-through caching needs two flags — one on the cache disk, one in the default profile — and TTL moves local→Amazon Simple Storage Service (S3) do pass through the destination disk’s write path, so they populate the cache.
The setup: one database per tenant
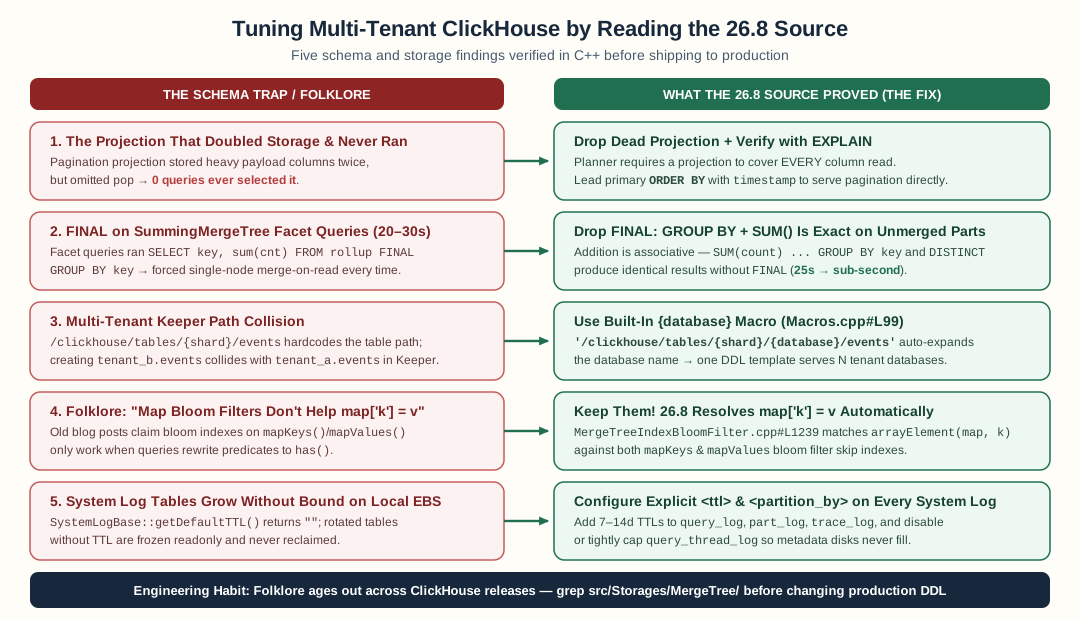
Verifying every optimization against the ClickHouse 26.8 source eliminated a dead projection, removed 25-second FINAL merge-on-read penalties, isolated tenant Keeper trees with {database}, preserved working map bloom indexes, and bounded system log tables with explicit TTLs.
The platform is multi-tenant the simple way: each tenant gets its own ClickHouse database on a shared cluster, and every query is routed against the tenant’s database. No shared-table row filters, no per-tenant columns — an entire database boundary per tenant. Storage tiering is the shape this series built: inserts land on local disks, merged parts TTL-move to per-tenant S3 prefixes, reads go through local cache disks.
That fresh-install moment is when schema mistakes are cheapest to fix.
The schema is one idempotent Structured Query Language (SQL) file: a raw log table, a chain of
rollup tables fed by materialized views (MVs), all Replicated* engines with
ON CLUSTER. The question I took into the source was simple: what in
this DDL is costing storage or latency that the source says it
shouldn’t?
flowchart LR
    subgraph tenants ["Shared ClickHouse cluster"]
        subgraph tA ["Database: tenant_a"]
            EA["events<br/>(raw logs)"]
            RA["rollup tables<br/>+ materialized views"]
        end
        subgraph tB ["Database: tenant_b"]
            EB["events<br/>(raw logs)"]
            RB["rollup tables<br/>+ materialized views"]
        end
    end
    Q["Query"] -->|"routed to tenant's database"| tA
    Q -->|"routed to tenant's database"| tB
    EA -->|"MVs per insert batch"| RA
    EB -->|"MVs per insert batch"| RB
    tA -->|"parts TTL-move"| S3A[("S3 prefix<br/>data/tenant_a/")]
    tB -->|"parts TTL-move"| S3B[("S3 prefix<br/>data/tenant_b/")]
One DDL file, one Keeper cluster, one S3 bucket — N isolated tenant databases on top. Everything below is about what that one file should contain.
A projection that could never run
The log table’s DDL carried a pagination projection:
ALTER TABLE edge_requests ADD PROJECTION p_pagination
(
    SELECT request_id, timestamp, http_headers, waf_flags
    ORDER BY timestamp, request_id
);
The intent was sound: the dominant query in the user interface (UI) is cursor-paginated —
WHERE timestamp BETWEEN ... ORDER BY timestamp, request_id LIMIT n, resuming
from (timestamp, request_id) > (previous). The base table’s key led with a
different column, so the projection gave that access shape its own
storage layout.
Except the query also reads pop:
SELECT request_id, timestamp, pop, http_headers, waf_flags
FROM edge_requests
WHERE timestamp BETWEEN ... ORDER BY timestamp, request_id LIMIT 1000;
And a projection is only ever picked when its stored columns cover
everything the query reads. One missing column and the planner cannot
select it — not for this query, not for any query, ever. Meanwhile the
projection is materialized into every part the table writes. In a log
table, the two Map(String, String) payload columns are the bulk of the
bytes (this series’ measured example: a 182-mebibyte (MiB) table shrinks to 78 MiB
with codecs — nearly all of it in the payload). A projection that stores
both payload columns a second time doubles the table’s footprint to
serve zero queries.
That’s the failure mode worth naming: a projection’s cost is certain
and its benefit is conditional. It pays on every insert, every part,
whether or not the planner ever picks it. The condition is easy to
check and easy to get wrong — one SELECT list mismatch disqualifies it
forever, silently. Nothing warns you. system.query_log will show the
projection never appearing in a single plan.
flowchart TD
    subgraph insert ["Every INSERT: cost is certain"]
        P["New part"] --> B["Base part columns<br/>(id, ts, service,<br/>2 × Map payloads)"]
        P --> X["Projection copy<br/>(id, ts, 2 × Map payloads)"]
    end
    Q["Pagination query<br/>SELECT ... pop ..."] --> C{"Projection covers<br/>every column read?"}
    C -->|"pop missing — NO"| BASE["Read from base part<br/>(projection never selected)"]
    C -->|"all columns present — YES"| PROJ["Projection used"]
    B --> BASE
    X -.->|"stored twice, read zero times"| C
There were three ways out:
- Fix the projection’s column list — add
pop. Now it gets picked, but the payloads are still stored twice. - Slim the projection to keys only —
(id, timestamp)— and fetch payloads in a second query byid IN (...). Halves the duplicate, adds an application round-trip. - Drop the projection and give the base table the access shape.
Option three is the one the source walk made obvious, because of what
the base key was doing: ORDER BY (toStartOfHour(timestamp),
pop, timestamp, request_id) — an hour-bucket-first layout from an era
when the queries bucketed by hour. For a cursor query over a raw time
range, that key buys nothing: the cursor comparison (timestamp, request_id) >
(ts, request_id) doesn’t match the key prefix, so every part needs sorting at
read time. Re-keying the base table:
ORDER BY (timestamp, request_id)
makes the pagination query stream by exact key prefix — no projection, no duplicate bytes, no per-part sort. The materialized-view chain is unaffected: MVs process the inserted block, not the table’s stored layout, so the ORDER BY is invisible to them.
The honest cost: pop left the sorting key, so
service-filtered scans can’t prune by key anymore. The fix is a skip
index:
INDEX idx_pop pop TYPE bloom_filter(0.01) GRANULARITY 1
A trade made in the open beats a projection that silently never ran.
The FINAL that wasn’t doing correctness any favors
The rollup tables are SummingMergeTree — rows keyed by (hour,
service, attribute), a count column, inserted by materialized views
per batch. Every consumer of those tables is an aggregate:
SELECT flag_value, SUM(count) AS count
FROM hourly_edge_summary
WHERE flag_key = 'action' AND hour BETWEEN ...
GROUP BY flag_value;
And every one of those queries ended in FINAL. The folklore says
SummingMergeTree rows aren’t merged until background merges run, so
without FINAL you read partial rows and get wrong counts.
Read the merge algorithm instead (SummingSortedAlgorithm.cpp): rows with an equal sorting key collapse; numeric non-key columns are summed; every other column keeps the last value. Two partial rows for the same key — sitting in two unmerged parts — each carry a partial count that adds to exactly what the merge would have produced. So:
SUM(count)over unmerged parts equalsSUM(count)over merged parts. The aggregation at query time performs the merge’s arithmetic.DISTINCTover the key columns yields the same set merged or unmerged — collapse only ever combines keys, it never introduces or removes distinct ones.
FINAL was paying full merge-on-read per query — and the price was
known: 20-30 seconds on these tables at this scale, with a thread-limit
setting (max_final_threads) that existed purely to manage the damage.
The facet panels issued these queries in bursts.
When does a SummingMergeTree query need FINAL? When you read a
non-summed column of a specific row — the merge keeps the last value,
so unmerged parts show multiple candidates and only FINAL collapses
them. SELECT flag_value, count FROM ... WHERE key = X without
aggregation is that pattern. My consumers never do it; they aggregate or
deduplicate. The fix was deleting FINAL — and the helper that decided
when to apply it, which had no remaining callers.
flowchart TD
    subgraph parts ["Two unmerged parts (no FINAL)"]
        PA["Part 1<br/>key=(10:00, api, level=error)<br/>count = 40"]
        PB["Part 2<br/>key=(10:00, api, level=error)<br/>count = 12"]
    end
    Q["SELECT ... SUM(count)<br/>GROUP BY key"]
    PA --> Q
    PB --> Q
    Q --> R1["40 + 12 = 52 ✓ exact"]
    M["Background merge<br/>(eventually)"] --> MC["One row:<br/>count = 52"]
    MC -->|"same answer"| R2["SUM(count) = 52 ✓"]
    QF["Same query + FINAL"] --> MR["Force merge-on-read<br/>first — then sum<br/>(20-30 s)"]
The general rule the source hands you: FINAL is a ReplacingMergeTree problem. It exists to collapse versioned duplicates. On SummingMergeTree your aggregations already are the merge.
One line that decides whether tenants can coexist
The replicated engines take a Keeper path: the table’s identity in the coordination tree.
ENGINE = ReplicatedMergeTree('/clickhouse/tables/{shard}/events', '{replica}')
Run that same DDL in a second database — tenant B after tenant A — and
the second CREATE fails in Keeper: the path is a literal string, and
{shard} expands the same in both databases. Two databases, one table
name, one Keeper node. The collision is structural, not a tuning
problem.
The fix is an implicit macro most DDL never uses:
ENGINE = ReplicatedMergeTree('/clickhouse/tables/{shard}/{database}/events', '{replica}')
In Macros.cpp,
when a macro named database, table, or uuid isn’t defined in the
server’s <macros> config, it expands from the table’s own identity —
the database the CREATE runs in. Each tenant database resolves the path
to its own tree in Keeper. One DDL file, N isolated tenants, no
per-tenant templating.
Three caveats the source also teaches:
- Defining a macro literally named
databasein your server config disables the implicit expansion — the config loader logs a warning when it sees one (Macros.cpp). - Replicated tables whose paths contain the implicit
{database}or{table}refuse to be renamed — the storage checks and declines (StorageReplicatedMergeTree.cpp). The path is the identity; renames would re-key it. ON CLUSTERDDL executes per database context — each replica expands{database}against the database it’s creating in, which is the tenant’s. The macro and the DDL queue agree.
flowchart TD
    subgraph noDB ["Without {database}: collision"]
        A1["db tenant_a:<br/>CREATE events"] --> K1["/clickhouse/01/events"]
        B1["db tenant_b:<br/>CREATE events"] --> K1
        K1 -->|"NODE_EXISTS:<br/>second CREATE fails"| X1["✗ one table max"]
    end
    subgraph withDB ["With {database}: isolation"]
        A2["db tenant_a:<br/>CREATE events"] --> K2["/clickhouse/01/tenant_a/events"]
        B2["db tenant_b:<br/>CREATE events"] --> K3["/clickhouse/01/tenant_b/events"]
        K2 --> Y1["✓ isolated tree"]
        K3 --> Y2["✓ isolated tree"]
    end
The index claim I got backwards
Mid-pass I nearly committed a “cleanup”: the log table carried bloom filter indexes over the attribute map:
INDEX idx_waf_key   mapKeys(waf_flags)     TYPE bloom_filter(0.01) GRANULARITY 1,
INDEX idx_waf_value mapValues(waf_flags) TYPE bloom_filter(0.01) GRANULARITY 1
Folklore says these only accelerate has()/mapExists()-style
predicates, and my queries filter with subscripts —
waf_flags['action'] = 'block'. Dead weight, I thought. Write
cost on every part, zero read benefit. Delete.
Then I read the bloom filter’s condition analyzer
(MergeTreeIndexBloomFilter.cpp)
and it explicitly handles arrayElement(map, 'key') = value — the lowered
form of every map['key'] = value predicate — resolving the map column
and the key against the indexed mapKeys()/mapValues() expressions,
hashing the key into the keys index and the value into the values
index. IN (set) too
(same file, the IN branch).
The indexes I was about to delete were accelerating the exact predicate
shape my queries use.
One genuine dead end the source did confirm: the rollup tables
materialize common facet keys as real columns, and a predicate on a
materialized column is invisible to the map index — the analyzer only
resolves arrayElement() calls and generated map subcolumns
(tryResolveMapInfoFromNode);
a plain materialized column is neither, so those predicates are on
their own.
The lesson isn’t about bloom filters. It’s that “this index is dead
weight” is a source-verifiable claim, and I was about to ship it on
hearsay. EXPLAIN indexes = 1 names which indexes a plan actually
uses — cheaper than being wrong in production either direction.
flowchart LR
    Q["WHERE waf_flags['action'] = 'block'"] --> LOW["Analyzer lowers to<br/>arrayElement(map, 'action') = 'block'"]
    LOW --> RES["tryResolveMapInfoFromNode"]
    RES --> KI["idx_waf_key<br/>mapKeys(...) bloom:<br/>'action' present?"]
    RES --> VI["idx_waf_value<br/>mapValues(...) bloom:<br/>'block' present?"]
    KI --> PRUNE{"Either says no?"}
    VI --> PRUNE
    PRUNE -->|"skip granule"| SKIP["Read fewer granules"]
    PRUNE -->|"maybe present"| SCAN["Read granule, verify rows"]
    M["Materialized column<br/>Action = 'block'"] -.->|"plain column — analyzer<br/>cannot resolve to the map index"| SCAN
The time column goes first
The rollup tables were keyed service-first:
ORDER BY (pop, minute, flag)
Every stats query arrives time-bounded:
SELECT toStartOfInterval(minute, INTERVAL 5 MINUTE, 'UTC') AS window_start,
       SUM(count) AS log_count
FROM minute_edge_summary
PREWHERE minute BETWEEN '...' AND '...'
GROUP BY window_start;
With the service column leading the key, the time predicate can’t prune by key prefix — the scan walks every service’s granules in the window. Re-keying time-first:
ORDER BY (minute, pop, flag)
puts the dominant predicate on the leading column, where MergeTree’s
granule skipping actually works. PREWHERE keeps the payload columns
untouched until the filtered rows are known — the key order is what
decides how many granules survive.
flowchart TD
    subgraph oldkey ["ORDER BY (service, minute, ...) — time buried"]
        Q1["PREWHERE minute BETWEEN 10:00 AND 10:05"] --> SCAN1["Read every service's<br/>granules in the window<br/>(no key-prefix pruning)"]
    end
    subgraph newkey ["ORDER BY (minute, service, ...) — time first"]
        Q2["PREWHERE minute BETWEEN 10:00 AND 10:05"] --> IDX2["Primary index:<br/>key range → only the<br/>10:00-10:05 granules"]
        IDX2 --> SCAN2["Read just those granules"]
    end
    SCAN1 --> C1["rows survive<br/>full row-level filter"]
    SCAN2 --> C1
The SummingMergeTree semantics are untouched by the re-keying: collapse
happens on full sorting-key equality, which is order-independent.
(minute, pop, flag) merges exactly the same rows
(pop, minute, flag) does. Only the read path changes.
Two more TTL details from the same pass, both from the source’s behavior rather than any doc:
ttl_only_drop_parts = 1everywhere. A part whose rows are all past the TTL is dropped as an object; with day partitions and day-bounded retention, expiry becomes one metadata-only DELETE per part instead of a row rewrite. My rollups were partitioned weekly with daily TTL and missing the setting — the worst case: a part almost always contains some live rows, so every expiry rewrites.- Align retention across the chain. The minute rollup expired a day before the raw table. Stats silently cover less history than the raw logs users can still pull. Align them or explain the gap.
The system log that never expires
Not a tenant table, but the same disk: ClickHouse’s own log tables.
The spec configured query_log with a TTL — 14 days, partitioned
monthly — and configured query_thread_log, part_log, and
metric_log with sizes and flush intervals but no TTL at all.
The base class says why that’s a leak — the config read for a system
log’s ttl defaults to an empty string, which builds the table with no
TTL clause at all
(SystemLog.cpp):
/// TTL expr is not necessary.
String ttl = config.getString(config_prefix + ".ttl", "");
if (!ttl.empty())
    log_settings.engine += " TTL " + ttl;
Most system logs are created with no TTL. Unbounded is bad enough —
but the rotation logic in
SystemLog.cpp
makes it permanent: when a log hits max_size_rows, the existing table
is renamed (query_log_0, query_log_1, …) and the rotated table is
frozen readonly as an optimization, so it wastes no central processing unit (CPU) on
background work. Readonly tables don’t run TTL drops. The comment in
the source is explicit: only the logs configured with a TTL stay
writable and reclaimed. Every TTL-less rotation leaves a frozen,
full-sized table on disk forever.
query_thread_log is the fastest grower of the family — one row per
thread per query, so a 32-thread query logs 32 rows. part_log is the
one you want kept for diagnosing hot→S3 part moves, which makes it the
one you’ll miss if it rotates into a readonly brick. The fix is
mechanical:
flowchart TD
    L["System log table<br/>(query_thread_log, part_log, ...)"] --> G{"ttl configured<br/>in server config?"}
    G -->|"NO (the default:<br/>ttl = empty string)"| ROT["max_size_rows hit →<br/>rotate to query_log_N"]
    ROT --> FRZ["Rotated table frozen<br/>readonly (no TTL to run,<br/>even if it had one)"]
    FRZ --> LEAK["Full-size table on disk<br/>FOREVER — every rotation<br/>adds another"]
    G -->|"YES: event_date + INTERVAL 14 DAY"| TTL["Background TTL drops<br/>expired partitions"]
    TTL --> OK["Table stays bounded"]
part_log/partition_by: "toYYYYMM(event_date)"
part_log/ttl: "event_date + INTERVAL 14 DAY DELETE"
query_thread_log/partition_by: "toYYYYMM(event_date)"
query_thread_log/ttl: "event_date + INTERVAL 14 DAY DELETE"
…for every log the cluster runs.
Write-through caching is two flags, and TTL moves do populate the cache
Last one, from the storage side of the tiering setup. A cache disk
(type=cache) wrapping an S3 disk can write-through — caching bytes as
they’re written, not just as they’re read back — but only if both of
these are set:
cache_on_write_operationson the cache disk in the storage config,enable_filesystem_cache_on_write_operationsin the default profile — defaultfalse, and the setting’s own documentation names the pairing: write-through is enabled “as long ascache_on_write_operationsis turned on in the server config’s cache disk configuration section” (Settings.cpp).
The write path checks both before wrapping the write buffer (CachedObjectStorage.cpp). One flag without the other is silently half-on.
The subtler question was whether TTL moves — local disk → S3, the tiering
heartbeat — even pass through the cache. The copy shortcut that would
bypass it is the S3 server-side CopyObject (copyObjectToAnotherObjectStorage),
but that path only applies S3→S3. A local→S3 move goes
copyDirectoryContent → copyFile → the destination disk’s
writeFile
(IDisk.cpp)
— and the destination disk is the cache wrapper. So with both flags set,
a part TTL-moved to S3 is written through the cache on its way up, and
the first query after the move reads it locally instead of
re-downloading it.
That’s a paragraph you can only write by reading the copy path. No doc I’ve found states whether moves populate the cache; the source does.
flowchart TD
    subgraph flags ["Both flags required — either alone is silently half-off"]
        F1["Disk config:<br/>cache_on_write_operations"] --> AND{"AND"}
        F2["Profile setting:<br/>enable_filesystem_cache_on_write<br/>(default false)"] --> AND
    end
    MOVE["TTL move:<br/>local part → S3"] --> PATH{"Copy route?"}
    PATH -->|"S3 → S3 only"| SSS["copyObjectToAnotherObjectStorage<br/>(server-side CopyObject —<br/>bypasses cache)"]
    PATH -->|"local → S3"| COPY["IDisk::copyFile →<br/>destination disk writeFile"]
    COPY --> WRAP["Destination disk IS<br/>the cache wrapper"]
    AND -->|"both on"| CWT["Write buffer wraps<br/>through the cache"]
    CWT --> HIT["First query after the move<br/>reads locally — no re-download"]
    WRAP --> CWT
What transfers
The fixes are tenant-database-specific in their details. The method is the transferable part:
- Pin the version you run, read the source at that version. Every claim here was checked against the 26.8 tree this cluster runs. Folklore has a version it was true for; the source has yours.
- Costs are certain, benefits are conditional. Projections, skip
indexes, TTL rules — they all pay on write. Verify the condition
(
EXPLAIN,system.query_log) before paying, and again before removing one that looks dead. - Let the read path pick the key. Time-bounded queries want the time column leading. Cursor queries want the cursor tuple to match the key prefix. The engine family’s collapse semantics are order-independent — the read path is the only thing your key order decides.
- The merge math is knowable. SummingMergeTree sums numeric
non-key columns at merge; your
SUM()does the same arithmetic at query time. FINAL is for ReplacingMergeTree-shaped problems, not aggregation-shaped ones.
The multi-tenant schema is now one idempotent file — replicated engines,
{database} in every keeper path, time-first keys, TTLs aligned with
the partition grain — and it applies cleanly to every tenant database
the cluster adds.
Previous: The S3 Path Bug Nobody Sees: Silent Config, Shattered Tenants, and a CAS-Ready Fix.
Series index: ClickHouse on Amazon Web Services (AWS): Self-Managed from First Principles.
FAQ
How do you know a ClickHouse projection is never actually used?
The planner can only pick a projection whose stored columns cover everything the query reads. My pagination projection stored request_id, timestamp, and the two payload columns, but the query also read pop — one missing column and the projection is never selected, on any query, while still being written into every part. Verify with EXPLAIN (look at the ReadFromMergeTree node's projection analysis) before assuming a projection earns its storage.
When does a SummingMergeTree query actually need FINAL?
Only when you read non-summed columns of specific rows — the merge keeps the last value of any column that isn't summed. If your query is SELECT key, SUM(count) ... GROUP BY key, or DISTINCT over key columns, it is exact across unmerged parts without FINAL: two partial rows for the same sorting key add to the merged value, and DISTINCT collapses to the same set. FINAL forces a merge-on-read per query, which on my facet queries cost 20-30 seconds each.
How do multiple tenant databases share one ClickHouse cluster?
Give every tenant its own database and put the implicit {database} macro in the replicated table paths: ReplicatedMergeTree('/clickhouse/tables/{shard}/{database}/events', '{replica}'). The macro expands from the table's identity ([Macros.cpp](https://github.com/ClickHouse/ClickHouse/blob/b47359294fe0f498ee19c5e31f18a9155b6dedae/src/Common/Macros.cpp#L99)), so the same DDL file creates an isolated Keeper tree per database. Without it, two databases with the same table name collide in Keeper and the second CREATE fails.
Do bloom filter indexes on mapKeys() and mapValues() help map['key'] = value predicates?
Yes — counter to the folklore that they only serve has() and mapExists(). The 26.8 bloom filter analyzer resolves arrayElement(map, key) = value and IN (set) against the indexed mapKeys()/mapValues() expressions ([MergeTreeIndexBloomFilter.cpp](https://github.com/ClickHouse/ClickHouse/blob/b47359294fe0f498ee19c5e31f18a9155b6dedae/src/Storages/MergeTree/MergeTreeIndexBloomFilter.cpp#L1239)). One caveat: a materialized column that shadows a map key is just a plain column to the analyzer — it only resolves map subcolumns and arrayElement() calls, so predicates on the materialized column bypass the map index.
Why do ClickHouse system log tables grow forever?
System logs have no default TTL in open-source ClickHouse (SystemLogBase::getDefaultTTL returns an empty string). Worse, when max_size_rows triggers rotation, the rotated table is frozen readonly as an optimization — and readonly tables never run TTL drops. Only logs configured WITH a TTL stay writable and get reclaimed. query_thread_log grows fastest: one row per thread per query.
Stay in the loop — production notes on AI agents, workflows, and SRE.
Low volume — new posts and curated reading lists. Unsubscribe anytime.