Empty PromQL ≠ Missing Data: Fix AI SRE Scope Blindness
Grafana, a monitoring interface, may return no_data for a PromQL (Prometheus query language) request. An empty result means the particular query found no matching time series (measurements tracked over time) in its requested window. It does not establish that the underlying signal is absent: labels, time range, data source, or query type may be wrong. An AI agent helping site reliability engineering (SRE) responders should check those possibilities before concluding that data is unavailable.
The incident patterns below are composite and anonymized. Counts are rounded. Names, IDs, and infrastructure details are fictionalized to protect customer confidentiality.
What an empty result actually tests
An instant query samples one moment; a range query examines a period. A narrow label filter can miss the intended tenant or host, and a different system may hold the relevant logs or mapping. In evaluations described here, human re-queries found series after an agent had called metrics unavailable. The lesson is to record which query was empty, then try justified alternatives—not to assume every empty response conceals data.
Northstar Platform (composite example)
Fictional setup serving multiple customer tenants:
- Agent queries instant PromQL with narrow labels → empty
- Declares metrics unavailable; invents a capacity-storm story
- Human runs the same measurement with discovered labels and a 7-day range → thousands of series
- Another monitoring system returns zero matching hosts; that result applies to that system and query, not all possible sources
Another composite follows Kafka lag—a backlog in a message-stream partition—through a tenant GUID (unique customer identifier) to customer impact. An instant count(...) at alert time returns 0, but a week-long range contains the mapping. The long range helps resolve identity; it does not by itself prove current impact. Writing UNRESOLVED before checking that range would lose a possible link.
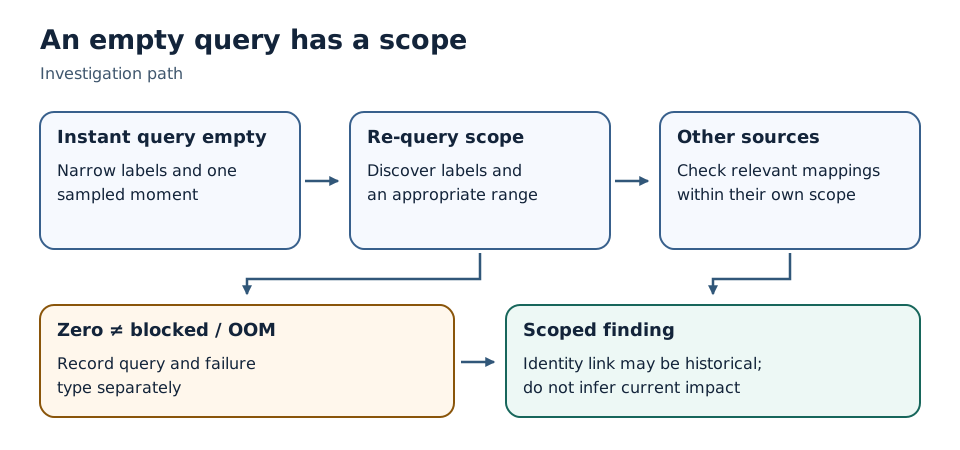
Diagram: The arrows widen the scope of an empty instant query by checking labels, range, and relevant sources; the lower path distinguishes a successful zero from a blocked request and limits any identity or impact claim to what was actually measured.
If you lead an SRE team
- Ask whether label discovery and an appropriate time range were tried before accepting “not enough information”
- Compare agent digs to a human re-query on the same identity before blaming the model
- Document the tenant-to-impact lookup steps for your environment, including their limits
If you ship the agent platform
- Treat one empty PromQL as inconclusive; check labels, time range, and relevant other systems before reporting absence
- Distinguish a circuit-open request (temporarily blocked after repeated failures) or an out-of-memory (OOM) tool-server failure from a successful query returning zero series
- Require measured evidence before proposing a capacity or traffic-storm explanation (hypothesis ladder)
Related
- Previous: Ungrounded Synthesis as Hypothesis
- Next: Measure the Firing Expression First
- Hypothesis ladder
Acknowledgments. Wrong-system / wrong-scope patterns from live investigate evals and multi-tenant skill work. Customer schemas renamed; narratives composite.
Building AI for incident triage without the demo theater? Find me on GitHub or LinkedIn.
FAQ
Does an empty PromQL result mean the signal is absent?
No. A query can miss data because of labels, time range, data source, or a tool failure. Check relevant alternatives before reporting not_enough_information, and record what remained unavailable.
What is scope blindness in AI SRE agents?
Treating one failed or empty query on one observability system (metrics vs logs vs warehouse) as proof that data does not exist, then filling the gap with a fluent storm narrative.
What fallback digs should AI SRE agents run after empty Grafana results?
Discover available labels, check an appropriate time range, and consult another relevant data source or customer-identity mapping when available.
Stay in the loop — production notes on AI agents, workflows, and SRE.
Low volume — new posts and curated reading lists. Unsubscribe anytime.