The Fleet That Could Not Heal Itself: TLS Storms, Dead DNS, and What 'Self-Healing' Actually Requires
ClickHouse on AWS: Self-Managed from First Principles · Part 29
I started a four-hour load soak expecting to watch dashboards. Instead I watched a cluster argue with itself for two days.
The errors came in waves that looked unrelated at first: a TLS storm from a client that did not exist, DNS lookups for machines that were long dead, CPU warnings from a monitor the autoscaler could not hear, and crashes in a code path I had never read. Each one taught me something about what “self-healing” actually means — and most of the lesson was that healing is not a property you can claim. It is a chain: something must see the failure, something must name it, and something must fix it. Break any link and your fleet limps along at full health-check compliance while serving nothing.
This post walks the waves, in the order they fell.
Key takeaways
- Self-healing has three layers — detection, diagnosis, remedy — and the TLS storm slipped through all of them. A node passing every health check can still be failing every client.
remote_serversis a membership document. Rendering it from reserved capacity instead of live leases means every distributed query retries dead names forever — and ClickHouse’s cluster parser will crash outright on a shard left with zero replicas.- ClickHouse ships its own CPU monitor, and it disagrees with the infrastructure’s CPU metric by design. If your autoscaler keys on the infrastructure number, you have two definitions of “overloaded” and only one of them can trigger a scale-out.
- Every recurring manual fix is a design confession. The day we stopped re-running DDL by hand and put the schema in the node’s boot bundle was the day the fleet actually healed itself.
Wave one: the TLS storm from nowhere
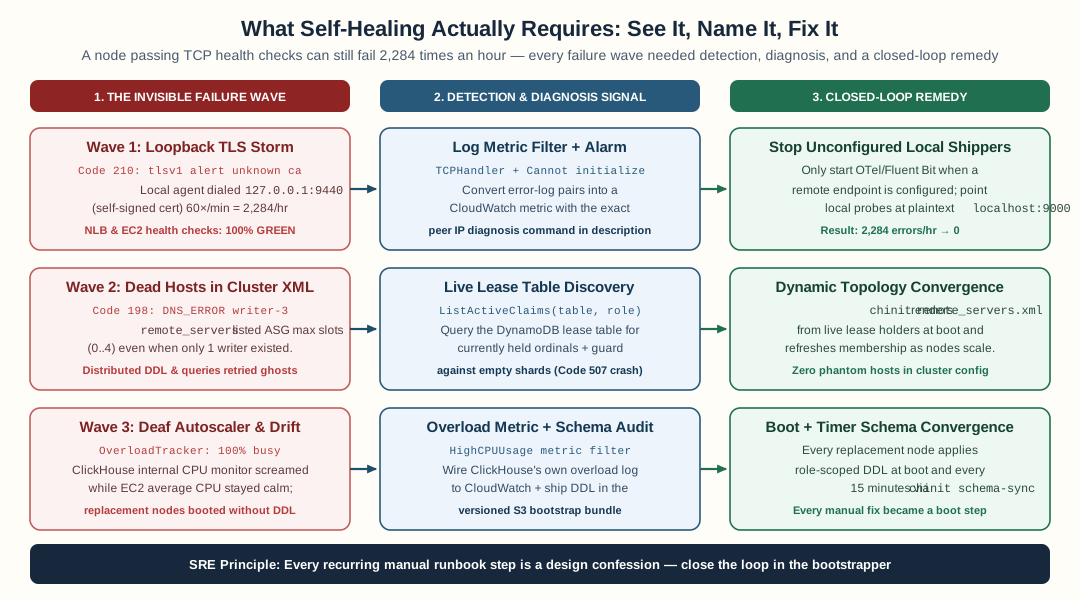
Self-healing requires all three links in the chain — detection, diagnosis, and a closed-loop remedy — across loopback TLS storms, phantom DNS entries in remote_servers, and internal CPU overload warnings.
The first wave looked like this in the error log, one pair every second:
{"severity":"Error","logger":"TCPHandler",
 "message":"Cannot initialize connection: Code: 210. DB::NetException: SSL Exception: error:0A000418:SSL routines::tlsv1 alert unknown ca, while reading from socket (peer: 127.0.0.1:34734, local: 127.0.0.1:9440)"}
{"severity":"Error","logger":"TCPHandler",
 "message":"Cannot send exception to client: ... Socket is not connected"}
The second line is noise — the server trying to report the first failure back over a socket the client had already closed. That pairing is diagnostic gold: when you see “cannot initialize” and “socket is not connected” together, one client is failing handshakes and hanging up mid-report. The real signal is the first line.
Decoding tlsv1 alert unknown ca:
- It is an alert the client sent during the handshake. The word “alert” in TLS means one side is telling the other what went wrong — this one says “I don’t recognize your certificate authority.”
- The peer was
127.0.0.1— the client was on the node itself. - Port 9440 is ClickHouse’s secure native protocol port — the TLS listener.
So: something on the node was dialing localhost’s secure port in a retry loop,
and rejecting the server’s certificate because the certificate’s CA was not in
its trust store. The server-side code that logs each failed handshake is
the Cannot initialize connection catch in TCPHandler.cpp —
one log pair per attempt, which is how 60 attempts a minute becomes 2,284
errors an hour.
Why was the certificate untrusted? Because in this topology, client TLS is
supposed to terminate at the network load balancer, which presents a
properly-signed certificate. The nodes behind it serve self-signed certs by
design — node-to-node traffic rides a separate internal port with its own
trust setup, and nothing is supposed to dial 127.0.0.1:9440 with a
public-CA expectation. The client doing so was misconfigured — pointed at the
node instead of the load balancer.
The gotcha: nothing in the fleet could see this. The node was up, accepting TCP, and passing every EC2 and load balancer health check. The autoscaling group saw a healthy fleet. The errors existed only as log lines with no alarm watching them.
The fix came in layers:
- Detection — a CloudWatch Logs metric filter on
"Cannot initialize connection"feeding an alarm above 10 hits a minute. The alarm description says what the line means and how to find the client:ss -tnp | grep 9440on the node catches the PID in the act. - Diagnosis — a runbook page that explains the three legitimate client shapes: connect via the load balancer DNS name (public CA works), connect to localhost on the plaintext port (no TLS needed), or connect to localhost’s TLS port with the node’s own CA in your trust store.
- Prevention — the recurring noise stopped when the client was fixed; the alarm stays armed for the next one.
Wave two: the cluster that listed its own dead
Once the TLS storm quieted, the next-largest error class was DNS failures — and this one was self-inflicted by design.
flowchart LR
    subgraph R["Rendered from RESERVED capacity"]
        direction TB
        R0["slot 01-0"]
        R1["slot 01-1 (vacant)"]
        R2["slot 01-2 (vacant)"]
        R3["slot 01-3 (vacant)"]
    end
    subgraph L["Rendered from LIVE leases"]
        direction TB
        L0["writer-0 (claimed)"]
        L1["reader-0 (claimed)"]
    end
    Q["Distributed queries,<br/>DDL worker, cluster fan-outs"]
    Q -->|"retries every name"| R
    Q -->|"only live members"| L
    style R fill:#ffe0e0
    style L fill:#e0ffe0
The cluster’s remote_servers config — the document that names every node a
distributed query may talk to — had been rendered from the autoscaling
maximum: five writer slots and four reader slots, whether or not anything
claimed them. A fleet of two live nodes was therefore carrying a membership
list with seven unresolvable names, and every cluster fan-out, every DDL
worker pass, retried them all. Hundreds of DNS failures an hour, forever,
from a config that was “correct” by its own render rules.
Two layers of fix:
- Render from live leases. Membership keys on claims — only a node holding a lease in the claim table appears in the config. Churn converges on the next render.
- The parser crash nobody expects. There is a second, sharper gotcha
here, and it lives in ClickHouse itself. Some generated cluster sections
put each replica in its own shard — so when you filter out a vacant
replica you can leave a shard with zero replicas, and the server does
not skip that shard gracefully. It calls
addresses.at(0)on the empty address vector in Cluster.cpp and dies withstd::out_of_range— at startup, while parsingremote_servers, before serving a single query. Every node rendered with the bad config crash-looped. The lesson: when you filter generated config, filter at the level of the container. Drop the whole shard when its last replica goes, not just the replica.
The one-line summary of wave two: a cluster definition is a membership document, not a capacity plan. If you render it from what could exist, the fleet spends its life retrying what doesn’t.
Wave three: the CPU monitor nobody listens to
The third wave was not an error at all — it was a warning, repeated every thirty seconds for hours:
High CPU usage: 100% busy (>= 90%) for at least 600 second(s)
This is ClickHouse’s own overload monitor, in
AsynchronousMetrics.cpp:
it measures busy time as 1 - idle - iowait, warns when it holds above 90%
for ten minutes, and clears at 85%. It is configurable —
resource_overload_warnings.cpu_overload_warn_ratio and its friends — and it
is not the number your infrastructure’s CPU metric shows.
The trap: our autoscaler keyed on the infrastructure’s per-node CPU average. The node running the S3Queue ingest was at 100% by ClickHouse’s internal measure — genuinely saturated — while the fleet-wide average sat comfortably under every scale-out threshold. Two definitions of “overloaded,” and only one of them could trigger a remedy.
The gotcha deepens on burstable instances: a t4g sustained at 100% is also
burning CPU credits, and when credits run out the effective rate drops
while the metric still reads ~100%. Your autoscaler sees a plateau and reads
it as “stable.” It is actually a node being throttled.
The fixes, in honesty order:
- An alarm on the internal monitor’s own line. A log filter on
"High CPU usage"makes the warning page. It is the only way the signal becomes actionable — the line is ClickHouse telling you it is overloaded in its own words. - Non-burstable instances for sustained load. We moved the ingest tier to
r8g— same arm64, no credit meter running at the worst moment. Constant load and burstable credits are a tax on exactly the days you cannot afford it. - A bigger queue node, or many. The deeper cause was architectural: all ingest funneled through one node’s queue table. The S3Queue engine is natively multi-node — deploy the identical queue table on every writer and Keeper-tracked file claims give you exactly-once processing across the fleet, with each node’s commit caps applying per node. Two writers doubled the ceiling; the fleet CPU dropped to single digits.
sequenceDiagram
    participant CW as CloudWatch (per-node CPU avg)
    participant CH as ClickHouse internal monitor
    Note over CW: reads 24-32% fleet average<br/>never crosses scale-out threshold
    Note over CH: reads 100% on the queue node<br/>warns every 30s into the log
    CH->>CH: "High CPU usage: 100% busy..."
    Note over CW,CH: Two definitions of "overloaded".<br/>Only CW could trigger a remedy.<br/>Only CH was correct.
The meta-lesson: manual fixes are design confessions
By the end of the soak I had a pile of recurring manual interventions: recreate the tables after a full churn, rewrite the lease rows after a race, re-deploy the queue per writer. Each one was a small script run over SSM — and each one was a confession that the design did not cover the case.
The fix that mattered most was not any single patch. It was moving the
schema itself into the node’s boot bundle: a DDL file shipped next to the
XML configs, hash-gated so any change rolls the fleet, executed
idempotently by a new boot step (CREATE ... IF NOT EXISTS with the node’s
own macros). After that, a fully-churned fleet re-materializes its own
tables on boot. The failure class “every node replaced at once, no peer
left holding the schema” — which we hit for real — stops requiring a human.
That is the shape of real self-healing. Not a dashboard claim. A chain: the failure is seen (a log filter feeds an alarm), it is named (the alarm text carries the diagnosis), and it is fixed (the remedy is a boot step, a config render, or an autoscaler — not a human with a script). Each wave in this post closed when its link in the chain was built.
The checklist that came out of it
If you run a fleet that claims to self-heal, ask these about every failure class you have met:
- What would see it? Not “could see it” — would. Is there an alarm whose state changes, or does the evidence live in a log nobody greps?
- What would name it? When the alarm fires at 3 a.m., does the description carry the diagnosis, or does it carry a metric name?
- What would fix it? If the answer is a person, that is fine — but say so, and write the runbook. If the answer is “the next boot” or “the autoscaler,” you have actual self-healing.
- Is the config that names the cluster a membership document or a capacity plan? Render membership from live state, and never ship a shard with zero replicas.
- Do you have one definition of “overloaded” or two? If the internal monitor and the autoscaler disagree, one of them is wrong, and your fleet behaves like the wrong one.
FAQ
Why didn't the autoscaling fleet heal the TLS error storm?
Because self-healing only acts on what it can see. The node was up, accepting TCP, and passing every EC2 and load balancer health check — the failures lived in a loopback client's TLS handshake and in log lines no alarm watched. Healing requires three layers working together: detection (an alarm that keys on the failure's signature), diagnosis (a runbook that names the hunt), and a remedy (a fix for the client's configuration). The fleet had none of the three for this class until we added them.
What is the 'unknown ca' TLS error about?
It is the client's verdict, not the server's. The server presented a self-signed certificate — by design, in a topology where TLS terminates at the network load balancer with an ACM certificate — and the client rejected it because the certificate's CA is not in the client's trust store. On ClickHouse the server logs it per failed handshake as a 'Cannot initialize connection' error in TCPHandler, and when a client retries in a loop you get thousands of pairs per hour.
Why would a cluster config list hosts that don't exist?
Because the config was rendered from reserved capacity, not live membership. The cluster definition reserved a fixed number of slots — the autoscaling maximum — so any node that hadn't yet claimed a slot rendered with an unresolvable placeholder name. Every distributed query, DDL worker pass, and cluster fan-out then retried the dead entries. The fix is rendering from the live lease table: only nodes that hold a claim appear in the cluster config.
How do you stop a log error storm without drowning in it?
You convert log lines into alarm-able metrics. A CloudWatch Logs metric filter turns each error signature into a count, the alarm fires above a threshold, and the alarm description carries the diagnosis command. The two filters that paid for themselves immediately: a TLS-handshake-failure filter and an internal-high-CPU filter — the classes that no infrastructure metric could see.
Stay in the loop — production notes on AI agents, workflows, and SRE.
Low volume — new posts and curated reading lists. Unsubscribe anytime.