Observation Masking Cut Token Cost 43%—Then Lost the RCA
We tried making a site reliability engineering (SRE) investigation cheaper by removing older, bulky tool results from the model’s active context. The host did this only after the agent had written a durable note it could read later. We call that observation masking, or tool-result clearing.
In a matched gateway-timeout investigation, clearing ran and the ON arm was faster and cheaper. But the OFF arm identified a probable connectivity failure between the gateway and an upstream service; ON could not determine the cause. A cheaper run did not meet our root-cause analysis (RCA) bar. Below are the setup, the observations, and the quality check we used. Related: AI SRE agent benchmarks, fair agent evals, simple vs plan.
The result
- Clearing fired, but the quality gate failed. ON recorded 2 auto-clear events and improved wall time and cost; it scored 5 on the equal-evidence checklist against OFF’s 6. Our pass rule requires ON ≥ OFF.
- v4 (primary): OFF 754.0 s / 75 tools / ~$1.75 vs ON 677.1 s (~10% faster) / 73 tools / ~$1.00 (~43% cheaper). Both passed recoverability via durable notes (
read_notes). - Evidence gap: OFF ran 8 Datadog and 21 Grafana calls, including full-result spill and time-series queries, and identified a probable upstream hop. ON ran 4 Datadog and 14 Grafana calls, with no full-series tools; its application performance monitoring (APM) path from caller to origin remained empty.
- Both called
discover_skills10 times. Repeated discovery was not specific to clearing. - A unit fixture is not a live cost estimate. A synthetic note-and-clear path can drastically reduce visible tool characters, but that is not a measured multiplier for an investigation.
- Next experiment: higher auto-clear threshold (~20KB-shaped) vs 0; summarize / extra compaction off; pass only on RCA parity.
What clearing changes
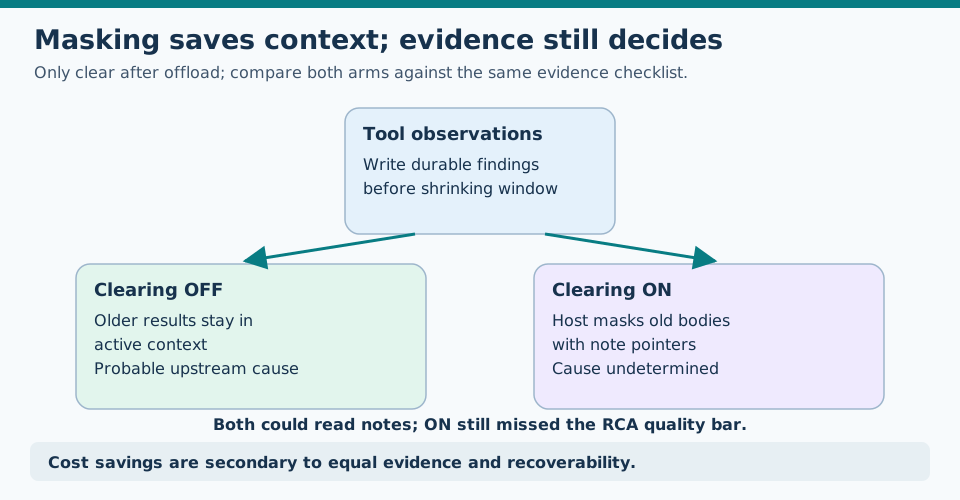
Caption: The ON run saved context cost but failed equal-evidence RCA parity; note readability alone was insufficient.
A model has a limited active context window: its instructions, conversation, and tool responses all compete for space. A large Grafana response can remain there long after a useful finding has been written down. LangChain’s Deep Agents context management describes offload before summarize: preserve useful findings outside the window before shrinking what remains. Observation masking hides older tool outputs while retaining recent turns and reasoning. Its value depends on whether the notes preserve what later steps need.
Here, tool-result clearing is our host-side observation-masking step after a successful note: large prior tool bodies in session context are replaced with short pointers so later turns stay smaller. It is opt-in (default off). A lightweight no-plan path can skip clearing when the run does not need it.
This is different from asking a language model to summarize the transcript, compacting the chat window, removing personally identifiable information (PII), or applying a grounding guard. Compaction remained on in both arms; the extra summarize paths remained off. The tested difference was the clearing setting.
Setup (obfuscated twins)
We ran matched plan-style incident investigations, one with auto-clear OFF and one with it ON. “Plan-style” means the agent used a planning step before investigating. The table separates shared settings from the setting under test:
| Lever | Both | OFF | ON |
|---|---|---|---|
| Compaction | ON | ||
| Summarize / extra context-summarize / cache / sanitize / PII / grounding guard | OFF | ||
| Loop detection | ON | ||
| Auto-clear tool-result bytes | 0 (off) | 8000 (bench forced fire; prod-shaped default when enabled is closer to ~20KB) | |
| Prompt | Same historical gateway timeout on a catalog API path | ||
| Surface | chat UI | ||
| Tools | Grafana + Datadog MCP tool servers |
The obfuscated scenario used tenant TENANT-UAT, request GET /api/catalog/v2/.../assets, caller edge-gateway, and origin catalog-service. Signals included error.type=ResourceAccessException, connection refused or connect timeout, and a gateway 504 (timeout). We report cost, latency, and tool counts from Langfuse traces, not customer trace IDs or secrets. These are observations from these matched runs, not a general estimate of what clearing saves.
What improved
ON recorded host auto-clear events (2 on v4; the recorded clear count progressed 2 then 4), while OFF recorded 0. This confirms that the experiment exercised clearing rather than merely toggling an unused option.
For the final recoverability turn, we forbade fresh evidence collection. Both arms used read_notes and could restate Symptom/Cause from durable notes. That tests whether findings remained accessible after the active context shrank; it does not test whether the findings were complete.
In v4, ON took about 10% less wall time including recoverability and cost about 43% less on agent traces excluding bootstrap. The earlier v3 run pointed the same way: OFF 520 s / ~$1.18 / 70 tools versus ON 471 s / ~$0.84 / 62 tools, with 1 ON clear event. The design also leaves clearing opt-in and off by default; a lightweight no-plan path can skip it. Loop detection was on to limit repeated calls, though discovery retries still occurred.
Where the investigation fell short
The v4 quality result went the other way:
| Metric (v4) | OFF | ON |
|---|---|---|
| Wall (incl. recoverability) | 754.0 s | 677.1 s (~10% faster) |
| Tool calls | 75 | 73 |
| Langfuse $ (agent traces, excl. bootstrap) | ~$1.75 | ~$1.00 (~43% cheaper) |
| Host auto-clear events | 0 | 2 |
Recoverability read_notes |
pass | pass |
| Equal-evidence checklist | 6 | 5 |
| Verdict quality | Probable upstream connectivity (edge-gateway → catalog-service; 504 + ResourceAccessException) | Undetermined |
Tool totals alone conceal which evidence was gathered:
| Family | OFF | ON |
|---|---|---|
| Datadog | 8 | 4 |
| Grafana | 21 (incl. full-result spill / series / parallel) | 14, no full-series tools |
| Skill/catalog discovery | 10 | 10 |
OFF’s APM and log queries supported a probable caller→origin connectivity explanation. ON did fewer of those queries, left that APM path unestablished, and reported an undetermined cause. The difference in tool use is associated with the quality gap, but one A/B does not prove that clearing alone caused every skipped query.
There are other limits to the test. Both arms could mark work complete without establishing a matching path. The 8KB threshold was chosen to force clearing in the benchmark; it is lower than the ~20KB production-shaped default when clearing is enabled. Repeated discovery or Datadog calls can also consume time before a useful query. These constraints matter when interpreting the cost and RCA results.
What not to infer
A 43% cost reduction with real clear events is worth studying, but it does not justify enabling this setting for investigations if it loses the evidence needed to identify a cause. Turning on summarization or another context-summarize path at the same time would make it harder to attribute any change to clearing; both were off here.
Our runtime also refuses to have an LLM summarize the durable note store. A recoverability probe can show that notes are readable, but if those notes have been rewritten and lost key details, the probe alone may give false reassurance. Check the evidence in the notes as well as the ability to retrieve them.
A synthetic note-and-clear unit path showed an order-of-magnitude drop in visible tool characters. Even a “512×” figure from such a fixture describes that fixture, not live investigation cost or RCA quality.
How we measured (adapt this checklist)
Pass only if all of the following hold:
- Informative gate. ON host auto-clear count > 0, or mark the run non-informative (you did not exercise clearing).
- Equal-evidence checklist (7 rows). Score each arm pass/fail; require ON ≥ OFF:
- Window anchored (time range honest to the incident)
- Caller→origin APM path closed (path measured)
- Origin logs /
error.typenamed when present - Infra / readiness checked when relevant
- Honest gaps: systems we could not query
- Gateway-as-symptom (do not stop at the 504)
- Recoverability (durable notes can restate Symptom/Cause)
- Recoverability probe. Final turn forbids new evidence collection. Must
read_notesand restate Symptom/Cause from notes only. - Cost gate (secondary). ON tokens / cost ≤ OFF after quality gates. Prefer later-gen tokens, Langfuse agent cost, and clear-event count over raw tool-call count.
- Tool-family mix. When RCA gaps appear, compare Datadog full-result spill and series queries with skill/catalog discovery calls. A similar total can hide different investigative coverage.
On v4: clear events > 0 ✓, cost/wall ON better ✓, recoverability both pass ✓, checklist ON ≥ OFF ✗ (5 < 6). Overall: FAIL.
v3 was directional only (same twins, earlier): cheaper/faster with one clear event. We did not treat it as the quality verdict. v4 is the one that closed the scorecard.
Knobs for the next rematch
Domain-agnostic, runtime-shaped:
| Knob | Guidance |
|---|---|
| Auto-clear tool-result bytes | 0 = off. This bench forced 8000. Next A/B: try ~20000 (prod-shaped when enabled) vs 0. |
| Summarize / extra context-summarize | Keep off when measuring clearing alone. |
| Loop detection | Keep on. |
| Compaction | Independent lever; do not silently change it mid-A/B. |
| Pass rule | Clear events fired and RCA parity (checklist ON ≥ OFF) and recoverability. Cost is a bonus, not the headline. |
For an investigation, a lower bill matters only after the run retains enough evidence to make the same defensible finding. A higher threshold may reduce the quality risk, but the next A/B has to test that rather than assume it.
What we will carry forward
- Confirm that clearing fired before treating a run as a clearing test.
- Compare the same evidence checklist in both arms before claiming a cost win.
- Inspect tool families when the RCA differs; 73 calls do not imply the right queries ran.
- Keep summarize off, loop detection on, and compaction fixed for the next clearing-only comparison.
- Treat fixture compression as a unit-test result, not a live multiplier.
- Write durable notes before shrinking the window, and do not replace the source-of-truth notes with a model summary.
The next comparison is ~20KB against 0. It passes only if ON retains RCA quality and the notes remain recoverable.
🚀 We’re building AI-powered SRE at StackGen. If you’re tired of 3 AM pages and want AI agents that triage incidents, run diagnostics, and draft RCA reports — check out ai.stackgen.com and try our new SRE offering.
FAQ
What is observation masking (tool-result clearing) for AI agents?
After a successful durable note (offload), the host replaces large prior tool results in the context window with short pointers so later turns stay smaller. It is agent context management’s host-side cousin of Deep Agents’ offload-before-summarize — not the same as LLM summarize or compaction.
Does cheaper agent context mean better AI SRE RCA?
Not in this A/B. ON was ~10% faster and ~43% cheaper with real clear events, but failed equal-evidence: fewer Datadog/Grafana digs, no full-series tools, empty caller→origin APM path, undetermined cause. OFF found a probable upstream connectivity failure. Scorecard OFF 6 / ON 5.
How should you evaluate tool-result clearing or observation masking?
Pass only if clear events fired, ON tokens/cost ≤ OFF, equal-evidence checklist ON ≥ OFF, and a recoverability probe that forbids new tool digs and requires reading durable notes. Prefer cost and tool-family mix over raw tool-call count.
What auto-clear threshold should you try next for context engineering?
Keep summarize and extra context-summarize paths off when measuring clearing alone. Leave loop detection on. Try a higher auto-clear byte threshold (~20KB when enabled in prod-shaped configs) vs 0, and pass only on RCA parity — not on token cost alone.
Is a huge unit-fixture compression ratio proof for live investigate?
No. A synthetic note+clear path can show tool chars collapsing after offload and clearing; that is a lab ceiling, not a live investigate multiplier. Do not lead marketing with that ratio.
Stay in the loop — production notes on AI agents, workflows, and SRE.
Low volume — new posts and curated reading lists. Unsubscribe anytime.