AI SRE Agent Benchmarks: Wall Time, Tool Calls, Tokens, and ReAcTree Tax
An AI agent for site reliability engineering (SRE) can finish a run without producing useful incident findings. A benchmark should measure both the result and the resources used.
For this incident-triage comparison, the useful questions were:
- How long until a closed Theory?
- How many tool calls burned the budget — and which families?
- How much data came back from observability tools?
- How many model completion units did the audit record?
- Was the cost orchestration (ReAcTree / multi-agent) or evidence shaping (summarize / compact / rewrite)?
We evaluated two distinct A/B test axes on the same class of incident-response job. One axis is orchestration shape — parent-first single agent vs a ReAcTree planner (full write-up). The other is evidence middleware — rewrite-friendly chat defaults vs evidence-preserving pass-through on a Grafana Node Not Ready paste. Same model family (gpt-5.4 / mini), same persona discipline, matched budgets. Keeping those axes separate is essential for honest AI agent benchmarking.
The scorecard below keeps the two axes separate; each pair is a small comparison, not a general performance distribution. Here Theory is the investigation’s proposed explanation, not an established cause.
The results in context
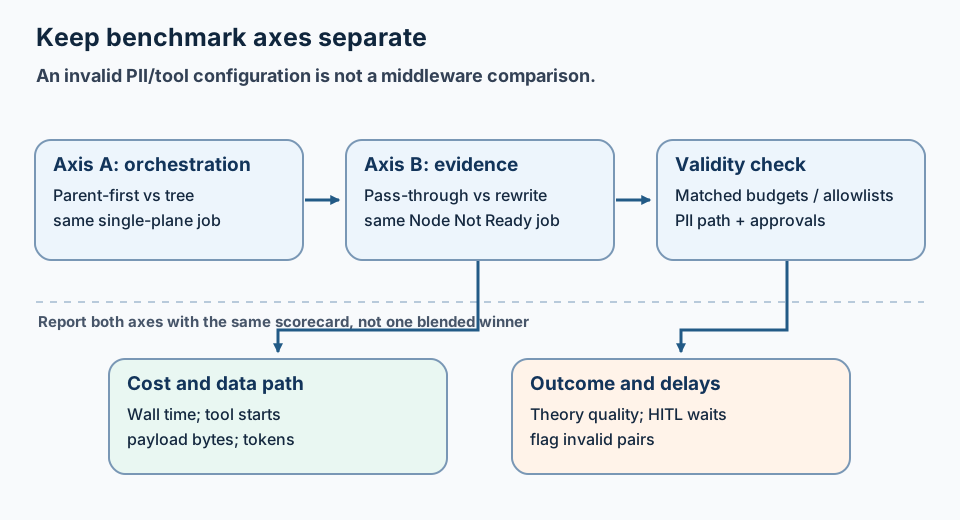
Compare one axis at a time and flag invalid configurations before interpreting costs.
- Measure four numbers together: wall time, tool-call starts, tool result bytes, model completion units — then ask whether Theory named real loci.
- ReAcTree tax is real on single-plane work: ~1.6× wall (~95s vs ~58s) and ~3.9× tools (27 vs 7) for the same findings.
- Fair evidence middleware A/B (Node Not Ready): both sides closed probable Theories on the same Ready=unknown locus. OFF finished in ~39s vs ON ~46s, tied at 10 tools, kept ~584 KB vs ~199 KB of tool-result text, and showed 0
[HIDDEN:]placeholders in the stream (ON had soft-caps + a few redacted tokens). - Misconfigured OFF is not a middleware A/B: rehydrate-off with BeforeModel PII still on → both undetermined, 0 fat Collect queries. Fix PII-off + exact tool allowlists before debating summarizers.
- Human-in-the-loop (HITL) waits affect wall time: unattended benchmarks that allow knowledge / notes-index tools can sit for minutes waiting for approval.
The orchestration pair asks whether extra agent loops helped a single-plane task. The middleware pair asks what happened when tool output was rewritten or passed through. Neither result should be attributed to the other axis.
Axis 1 — Multi-agent orchestration tax: ReAcTree vs parent-first
Job: read-only cluster health triage (one tool plane). The paths differ only by whether a planner may spawn children.
| Metric | Parent-first (single loop) | ReAcTree / multi-agent |
|---|---|---|
| Wall time | ~58s | ~95s (~1.6×) |
| Tool-call starts | 7 | 27 (~3.9×) |
| Child agents | 0 | 2 |
| Shell inspections | 3 | 3 |
| Completion-gate calls | 2 | 4 (root retries) |
| Finding quality | Same loci | Same loci |
What the tree paid for (and did not)
- Paid: coordination hops, child spawn, adaptive gate retries until the root called the completion tool.
- Did not pay for deeper kubectl: both sides ran the same three shell inspections and named the same NotReady node, stuck pod, and disk-pressure eviction.
Interpretation for this task: ReAcTree did not improve the findings and added coordination work. Parallel metrics, logs, and change-history digs may justify that cost, but this pair did not test such a job. Full decision framework: single-agent vs multi-agent.
Axis 2 — Evidence middleware on vs off (data & token path)
Job: investigate a Node Not Ready alert through Grafana tools — parent-first only (no planner). Differ by whether the runtime rewrites tool I/O (loop traps, semantic cache, context shaping, auto-summarize, session compaction, LLM-boundary + note PII) or passes evidence through (those gates off, including PII redaction off).
Prompt (same paste both sides):
[FIRING] Node Not Ready
Inside cluster developer-eks, node ip-10-0-2-33.us-west-2.compute.internal:
node not ready for more than 15 minutes
Fair rematch scorecard
Contract for OFF: PII redaction off (model + notes) and placeholder rehydrate off; compaction / summarize / context shaping / cache / loop off. Collect tools pinned by exact registry names (wildcard allowlists do not expand). ON keeps standalone rewrite defaults.
| Metric | Middleware ON (rewrite-friendly) | Middleware OFF (evidence-preserving) |
|---|---|---|
Wall time to RUN_FINISHED |
46.3s | 39.0s (~1.2× faster) |
| Tool-call starts | 10 | 10 |
observability_query (fat series) |
4 | 2 |
| Soft-cap @16k tool results | 2 | 0 |
| Σ tool-result chars (SSE) | ~199 KB | ~584 KB (~3×) |
| Max single tool-result | ~90 KB | ~411 KB |
[HIDDEN:] in SSE |
4 | 0 |
| Theory | Probable Ready=unknown / unreachable ~21:30Z; fire ~21:36:10Z | Probable Ready true→unknown ~21:20Z; activeAt 21:36:10Z |
Bottom line: once PII is truly off on the pass-through twin and Collect is pinned by exact name, middleware ON vs OFF shows up as evidence volume + soft-caps + a few extra ON queries — not as “both undetermined.”
Tool-call shape (fair rematch)
| Path | Sequence (abbrev.) |
|---|---|
| ON | notes → get alert rule → list firing → get alert rule → execute → observability ×4 |
| OFF | notes → discover/search → test connection → execute → get alert rule → list firing → observability ×2 |
Both closed the same locus class (single-node Ready=unknown / unreachable around fire time). ON burned more PromQL waves after capped dumps; OFF kept full series in-session and needed fewer Collect retries.
Data usage (tool payload bytes)
| Path | Σ tool-result chars | Max single result | Soft-caps / rewrite markers |
|---|---|---|---|
| Middleware ON | ~199 KB | ~90 KB | 2 results at 16k soft-cap |
| Middleware OFF | ~584 KB | ~411 KB | none in this pair |
Returned character volume distinguishes these paths after Prometheus Query Language (PromQL) or Loki query language (LogQL) calls return multi-series dumps — the regime where summarize / context shaping / compaction were designed to fire (evidence discarded, claim-aware packing).
Token usage (why bytes matter)
Tool results can increase later model input unless middleware compresses or stubs them. Here OFF returned ~3× more tool-result text and finished faster, but streamed character counts do not establish actual billed prompt tokens. Record provider token usage alongside these bytes when assessing cost; ReAcTree can also multiply root and child streams (tokenomics notes).
The blocker that made middleware look irrelevant (invalid earlier pair)
Before the fair rematch, both stacks closed undetermined with 0 fat observability_query calls (~32s / 18 tools on ON, ~43s / 17 on OFF). The model transcript showed placeholders where Grafana rule UIDs and even some tool-name tokens had been redacted for the model view.
That was expected on the rewrite-friendly path. It was a bug in the pass-through twin: turning off placeholder rehydrate without turning off LLM-boundary PII redaction still leaves [HIDDEN:…] in the prompt. Firing-instance calls failed validation (“UID must look like a real rule id — not a placeholder”). The agent then asked for a plain-text UID / Explore link — classic two-view PII tension on the ON path; on OFF it was simply an incomplete gate set.
A second Collect unlock bug: wildcard tool allowlists like grafana_* do not pin Collect — names must be exact registry entries.
Evidence-preserving middleware OFF means PII redaction OFF — model boundary, notes, and rehydrate together. Rehydrate-only is not a fair A/B.
Fix that contract (and keep ON’s allowlists healthy) before attributing Theory quality to compaction or auto-summarize.
HITL: the metric that does not show up as a tool call
On early OFF attempts, the stream sat for long stretches on approval-required tools (knowledge search, notes index) with zero further tool starts. Wall clocks climbed while tool counts froze.
Unattended AG-UI benches must:
- Deny clarify / knowledge / browser tools that expect a human
- Always-allow the note plane the persona requires
- Treat a frozen tool count + rising wall time as a HITL hang, not “deep thinking”
That is the same class of pitfall that makes ReAcTree look “slow” when the planner is actually waiting on clarify (HITL paradox).
How the two axes compose
| Question | ReAcTree axis | Middleware axis |
|---|---|---|
| Do I need parallel digs? | Dominant | Secondary |
| Will fat tool bodies blow the context window? | Secondary | Dominant |
| Why is wall clock high with flat tool count? | Check HITL / gate retries | Check HITL / exempt-tool thrash |
| Why is Theory undetermined with many tools? | Wrong plane / orchestration | Incomplete PII-off twin, selectors, empty Collect |
| Why did OFF finish faster with more bytes? | N/A | Fewer Collect retries; no soft-cap → fewer re-queries |
An honest SRE agent scorecard is a matrix, not a single winner badge. The same discipline on public tool benchmarks: fair agent evals, orchestration tax, and failure modes.
Practical scorecard (copy this)
For every A/B run, record:
- Wall time —
RUN_STARTED→ closed Theory (or gate accept) - Tool-call starts — total + by family (shell / metrics / logs / change / gate / search)
- Tool data — Σ result length, max length, truncation / summarize markers
- Model spend — LLM request/response counts, Σ completion units (
choice_countor provider tokens), per-role if you split summarizer vs investigator - Orchestration — child spawns, gate retries, HITL waits
- PII / Collect contract — redaction off on the pass-through twin? Exact tool pins? Zero
[HIDDEN:]in the OFF stream? - Outcome — Theory present? Concrete loci? Same as human golden?
Then label the axis you changed. Changing ReAcTree spawning and middleware in one pull request (PR) makes attribution difficult.
Lessons learned
- Orchestration tax and evidence tax are different invoices. Pay ReAcTree for branching; pay (or refuse) summarizers for fat payloads.
- Same findings ≠ same cost. The EKS ReAcTree A/B tied on truth and lost on tools/time; the fair middleware rematch tied on Theory and diverged on bytes / soft-caps / wall.
- Zero fat queries means your middleware A/B measured Collect unlock, not compression. Rehydrate-off alone is Collect unlock failure dressed as “pass-through.”
- Fair OFF can finish faster while keeping more evidence. On this paste OFF was ~1.2× quicker with ~3× tool-result volume — wall time is not a proxy for “kept the dump.”
- Wildcard tool allowlists do not pin Collect. Use exact registry names.
- In this test, pass-through OFF disabled personally identifiable information (PII) redaction end-to-end (boundary + notes + rehydrate). That configuration is appropriate only in an authorized test environment with suitable data handling; human-in-the-loop (HITL) waits dominated early digs — fix those before debating compaction defaults for Aiden-hosted agents.
StackGen develops AI tools for site reliability engineering (SRE), including incident triage and diagnostic workflows. Product details are at ai.stackgen.com.
FAQ
What should you measure when benchmarking AI SRE agents?
At minimum: wall time to a closed verdict, tool-call starts by family, completion units from the model audit, tool result byte volume, and whether the Theory names concrete loci. Orchestration shape (single-agent vs ReAcTree) and evidence middleware are separate axes — do not collapse them.
How much slower was ReAcTree multi-agent vs parent-first on single-plane triage?
On our matched EKS health A/B, the planner path took about 1.6× wall time (~95s vs ~58s) and about 3.9× tool calls (27 vs 7) for the same findings — coordination and gate retries, not deeper inspection.
Does turning off summarization and compaction always improve RCA quality?
Only after a fair evidence-preserving twin: turn off LLM-boundary and note PII redaction together (not just placeholder rehydrate), and pin Collect tools by exact name. On a fair Node Not Ready rematch both sides closed probable Theories; OFF kept ~3× tool-result bytes and finished slightly faster, while ON soft-capped large dumps and re-queried more.
What is ReAcTree tax in AI agent orchestration?
ReAcTree tax is the extra wall time, tool calls, and model turns spent coordinating child agents, adaptive completion gates, and handoffs — worthwhile when work branches across planes, wasteful when one parent loop already owns the dig.
How do tool payload bytes relate to token usage?
Every tool result re-enters the next model context unless middleware compresses or stubs it. Measuring tool response length (and truncation markers) predicts prompt-token growth better than counting tool names alone.
Stay in the loop — production notes on AI agents, workflows, and SRE.
Low volume — new posts and curated reading lists. Unsubscribe anytime.