Relative Efficiency Scores Lie When Absolute Wall Doubles
A cohort-normalized efficiency score increased between two benchmark waves even though the leading agent took much longer. The score was answering “how did this seat compare with this wave?” rather than “did the operator wait less than before?”
What the evidence supports
- Our efficiency formula normalizes wall, tokens, and cost to the cohort median.
- In a slower wave, the median rises. Relative scores can improve while absolute wall and tokens get worse.
- Use relative scores to rank seats inside one wave. Use absolutes to compare harnesses across days.
- Example: xAI hierarchical wall 141s → 262s, relative eff 1.375 → 1.584. Rank 1 both times. Operator latency lost.
The formula we used
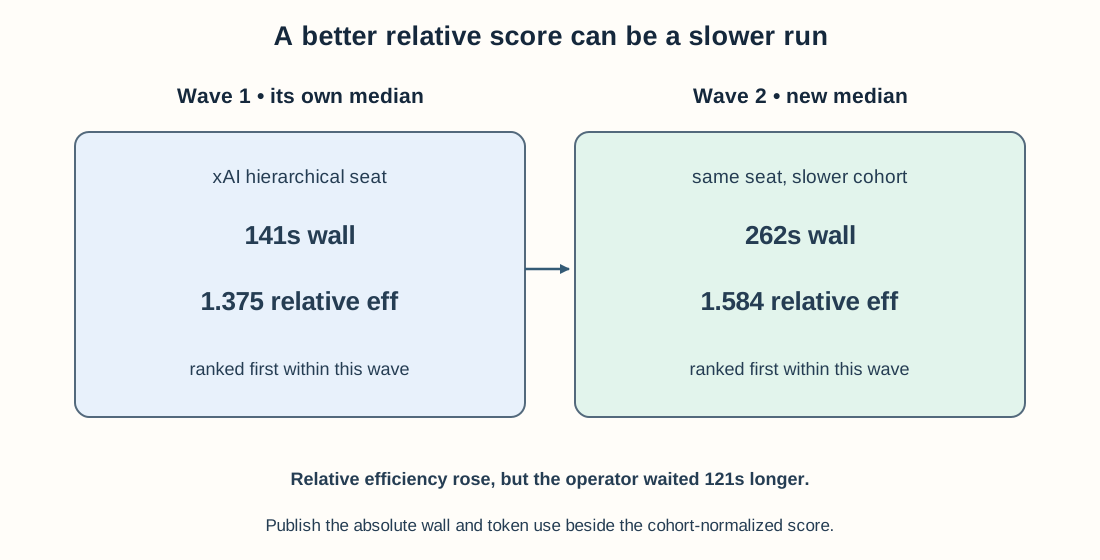
A candidate can rank first in a slower cohort while taking longer for users.
eff = correctness / (0.45·wall/median + 0.45·tokens/median + 0.10·cost/median)
Each denominator is divided by the median of the current six-seat cohort: wall-clock time, total tokens, and estimated or traced cost. This can rank the six combinations within a wave across single-agent ReAct and hierarchical ReAcTree (primer). Because the reference medians move, a changelog claim such as “efficiency +15%” across waves is not a fixed-scale comparison.
What to publish
| Field | Cross-harness? | Within-wave rank? |
|---|---|---|
| Wall seconds | Yes | Yes |
| Tokens in+out | Yes | Yes |
| USD | Yes | Yes |
| Correctness checklist | Yes | Yes |
| Relative efficiency | No (label it) | Yes |
Also log contention: the number of sessions sharing the Grafana tool server and whether runs were parallel. The second wave kept six clients active together, unlike a wave with four finished seats and a serial rerun. The 141s → 262s change cannot be assigned solely to the model or gates without controlling tool load.
A rule for changelogs and reviews
Absolute wall and tokens for the golden prompt. Relative efficiency only as a rank table.
A median-relative rank is useful for choosing among concurrent seats with the same task and tool conditions. For a service-level objective or a before/after deployment decision, compare absolute seconds and repeat under comparable load.
Related: web metrics → LLM metrics, fair evals before performance, same incident then swap models.
FAQ
Can efficiency go up when the agent is slower?
Yes. If you divide correctness by a resource index normalized to that run’s median, a slower cohort raises everyone’s denominator baseline. Rank stays useful; absolute wall is what operators feel.
What should dashboards show instead?
Absolute wall seconds, total tokens, USD, and a binary or checklist correctness. Keep relative efficiency as a within-cohort ranking aid only.
How did this show up in practice?
On a rematch with heavier Grafana contention, xAI hierarchical wall went from ~141s to ~262s while its relative efficiency rose. The product was not faster.
Stay in the loop — production notes on AI agents, workflows, and SRE.
Low volume — new posts and curated reading lists. Unsubscribe anytime.