Observability Tools Agents Actually Call on Triage
An agent runtime is the software loop that lets a model call tools and carry results forward. In our six-combo bench, agents investigated one alert and one log anomaly. The runs that met the grading checklist used a small set of live-data tools. This is a description of that job, not evidence that larger catalogs are generally harmful.
We ran both a single-agent ReAct loop (one model alternating tool calls and observations) and a hierarchical ReAcTree planner (a parent can assign subgoals to children; primer · PDF). The table below uses the single-agent traces because their tool calls are visible in one stream. Inspect child traces before drawing conclusions about a hierarchical run.
What the evidence supports
- Live signal tools that mattered: alert rule fetch, firing instances, PromQL/LogQL query, occasional execute_command.
- Context tools that appeared but are not evidence:
search_tools,discover_skills,load_skill, notes. - Common dead ends: empty
search_filepath, absolute paths into truncated tool dumps, LogQL transport timeouts. - Count measurement separately from catalog. A first-turn progress gate should not count a tool lookup as a measurement of the alert.
The menu that showed up in good closes
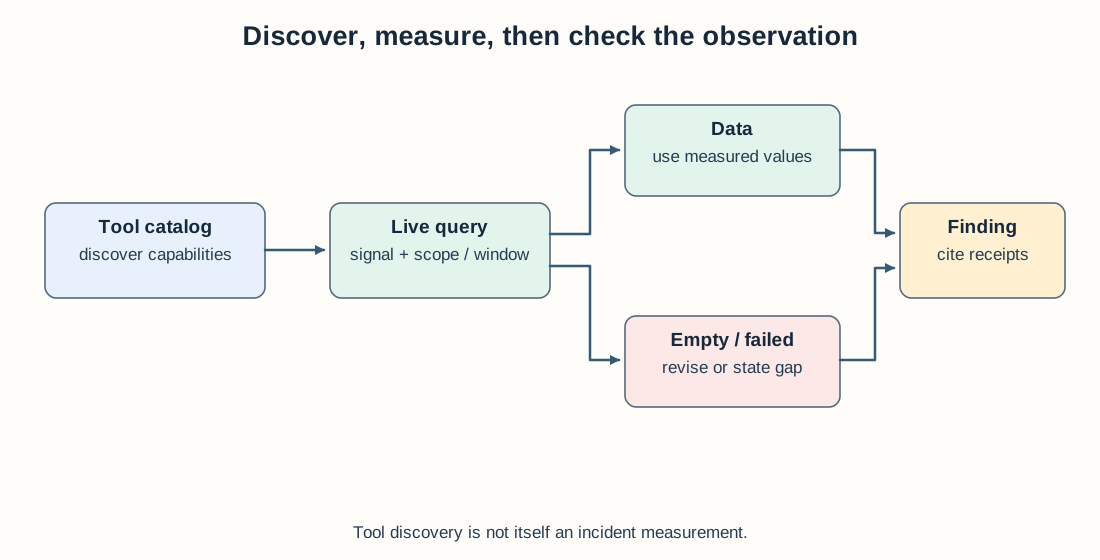
Finding a tool is only the start; the returned measurement must support the final claim.
For the single-agent runs on this Grafana/Loki task, these were the tool families worth separating. PromQL queries read metrics; LogQL queries read Loki logs. A catalog lookup only tells the agent what tools exist; it does not test the incident hypothesis:
| Tool family | Role |
|---|---|
*_get_alert_rule |
Confirm expr, for, labels |
*_list_firing_instances |
Anchor fired_at / current series |
*_observability_query |
PromQL slopes + LogQL volume/errors |
*_execute_command |
Denser follow-ups when query wrapper is awkward |
search_tools / discover_skills |
Orientation only |
note / budget checks |
Bookkeeping |
Hierarchical ReAcTree streams sometimes collapse tool names in the parent seat when the parent measures first and children dig later. Do not read “0 grafana_* in parent log” as “no measurement happened.” Check child or merged tool spans in your session traces.
Dead ends worth instrumenting
From the same runs:
search_filewith empty path — instant reject. Preview reasoning seats hit this early.search_contenton absolute/tmp/...dump paths — path policy correctly refuses; agent retries waste turns unless the host returns a relative dump id.- LogQL 504 / transport errors — a gateway timeout means the backend did not return a usable log result. Treat a typed
failedenvelope as upstream failure; distinguish it from a successful, empty query, which means no matches for that query and window.
Design rules for the catalog
- Pin the collection-tool names for controlled evaluations so compared agents have the same route to live evidence (fair agent evals). In production, discovery may still be useful when tools change.
- Separate retrieval / catalog classes from live-signal classes in your loop detectors.
- Where the same backend query can be expressed through several wrappers, test whether a single documented query tool reduces selection errors. Specialized wrappers can still be justified by permissions or safer input constraints.
- Truncated-output tools must accept the ids your summarizer emits, not absolute host paths.
Related: What is ReAcTree?, single-agent vs multi-agent, loop detection, empty query ≠ absent signal.
FAQ
Which Grafana tools mattered on the dual-part alert+logs job?
get_alert_rule, list_firing_instances, observability_query (metrics and LogQL), and execute_command for denser probes. Catalog tools (search_tools, discover_skills) showed up but did not count as measurement.
Do agents need dozens of observability tools exposed?
Not for this job. Successful closes clustered on a handful of query primitives. Extra catalog and filesystem tools mostly produced invalid-path and empty-path failures.
What failed repeatedly?
Absolute paths into truncated tool-output stores in search_content, empty path on search_file, and transport timeouts on heavy LogQL. Hosts should treat those as typed failures, not successes.
Stay in the loop — production notes on AI agents, workflows, and SRE.
Low volume — new posts and curated reading lists. Unsubscribe anytime.